Do more with bar charts in Tableau 10


Update: Tableau 10 is here! Download now to try out the feature outlined below.
Bar charts are a staple in data visualization. They are often the first chart type that comes to mind when comparing quantities across discrete groups such as sales amount for different product categories.
But there are many cases where you may want to take advantage of the width of the bars and their location along the axis to present more information. For example, if you’re visualizing the number of customers by age group and the age groups are of unequal sizes, you may want to use bars of different width.
Tableau 10 gives you precise control over the width of the bars, enabling many new scenarios and even new chart types.
When you have a bar chart with continuous fields on Rows and Columns shelves, you will see a new option appear in the size menu.
By using the fixed option, you can either type in the exact value for the bar width, or you can place a field on the Size shelf to size each bar differently.
In automatic mode, Tableau will apply smart defaults when possible. For example, histograms will have bars matching bin size. And time periods will be sized according to their granularity and length. This way, bars will be flush against each other and won’t overlap on resize. If you look closely, you may even notice that in your time-series chart, the bar for February is a little bit narrower than other months.
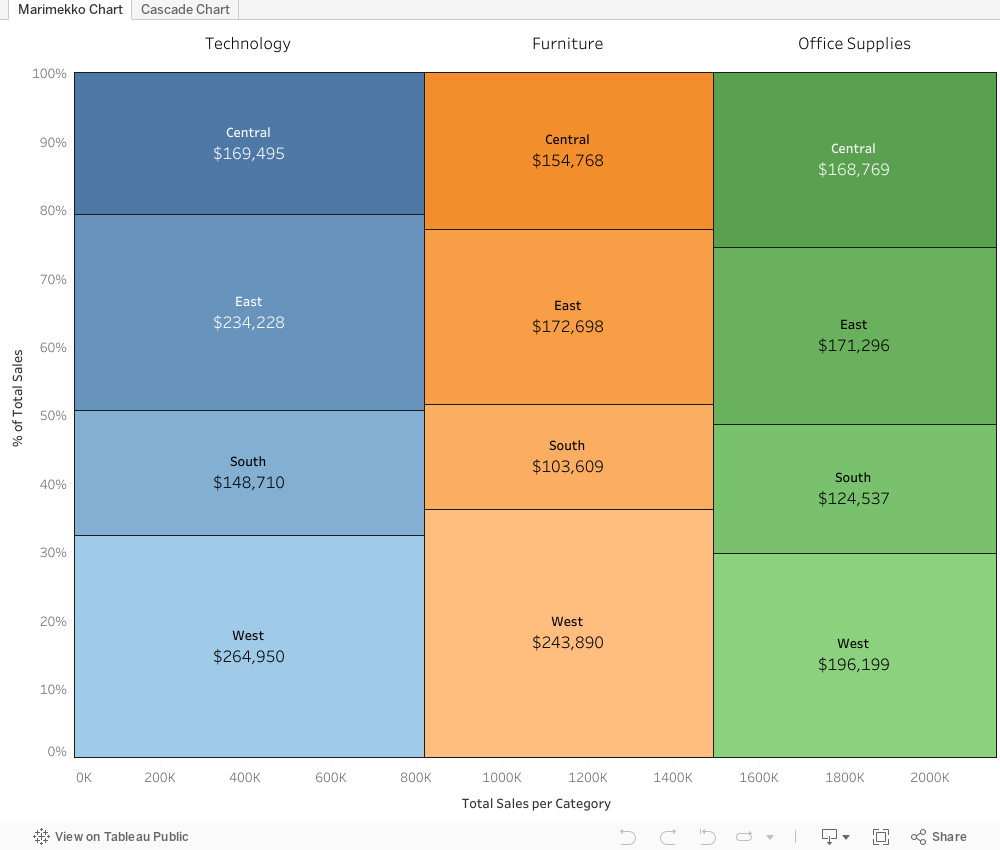
If you like to stretch your Tableau muscles, you can even build new chart types like Marimekko charts, cascade charts, or stepped areas by taking advantage of this new functionality.
Curious about these chart types? Take a look at the sample workbooks below!
Join the beta
We would love to hear what you think about the new and exciting features in Tableau 10.
If you haven't yet, check out our beta program to learn more and sign up. The beta program is available for existing Tableau customers. Customers with an active maintenance license can upgrade for free when Tableau 10 is released.
Learn more about Tableau 10
Tableau 10 includes a brand new look and feel, and a host of new features to help you prep, analyze, and share your insights even faster. Check out our Coming Soon page for details.
- Uncover patterns in your data with Tableau 10’s clustering feature
- Quickly find marks in context with Tableau 10's new highlighter
- Build your own custom territories in Tableau 10
- Tableau 10 includes more maps data, multilingual auto detection
Answers through analytics
- Integrate your data with cross-database joins in Tableau 10
- As requested, you can filter across data sources in Tableau 10
- Do more with APIs in Tableau 10
- Tableau 10 includes even more data-source options
- Connect directly to Google Sheets in Tableau 10
- (Finally!) see and understand your IoT data with our Google Sheets connector
- Connect directly to your QuickBooks online data in Tableau 10
- Favorite your data sources in Tableau 10
Data breakthroughs
- Check out the beautiful look and feel of Tableau 10
- Format your workbook with just a few clicks in Tableau 10
- How we designed the new color palettes
- Tableau 10 includes a new typeface designed for data
Beautiful by design
- Design dashboards that shine on any device in Tableau 10
- Tips for designing device-specific dashboards that make everyone happy
- Manage your Tableau Mobile deployment with AirWatch or MobileIron
Delightfully mobile
- Author dashboards from scratch on the web in Tableau 10
- Do more while publishing workbooks in Tableau 10
- See a history of your revisions in Tableau 10
- What's new in Tableau Online
Do more on the web
관련 스토리

5 Ways to Use Tableau Public to Achieve Your Goals
 2025/01/11

World Mental Health Day: Elevating Awareness Through Data Visualization
 2024/10/10

From TV Screens to Tableau: Visualize Your Favorite Shows with IMDb
 2024/08/31