How one university is instilling data skills in the next generation of business leaders
Digital skills top many employers’ wish-lists for new hires. In fact, jobs requiring digital skills, especially data analytics and visualization, will grow from 27% this year to 37% by 2026, according to the new IDC Salesforce Economy study. The study also predicts that 26,920 jobs specializing in next-gen data analysis will be added by 2026. The future of work will be driven by jobs related to artificial intelligence, cognitive systems, big data, and analytics.
One business school—and one of its many data-driven professors—is preparing students for a data-first world. Professor Gray Hunter, along with other leaders and faculty from the Eller College of Management at the University of Arizona, knows that data skills are essential for all future business students. That’s why Gray has spent the past four years championing data literacy and integrating data skills into the college’s courses and learning opportunities.
Data literacy starts in the classroom
Gray first learned about Tableau in meetings with employers who hire Eller graduates. They wanted business students with more experience in data management and visualization and often cited Tableau as one of the skills they looked for in graduates.
“We spend a lot of time motivating the importance of data skills and how they are necessary for anyone going into business,” Gray said. “Tableau is user-friendly, it really helps students get over that initial ‘I can’t do this’ or ‘I am bad with technology’ mindset they often come into the course with. It is so easy to play around with, it helps them build confidence to explore, not just with Tableau but with other technologies.”
Eller’s technology initiative has had some major wins. Most notably, the college collaborated with alum, Iron Viz champion, and lead solutions engineer for Tableau, Christian Felix, to build three Tableau use cases to incorporate into the undergraduate stats class, taken by 1,500 or so students each year. Christian also mentored an Eller student, Parth Agarwal, who was celebrated as one of three winners in the Tableau Public Iron Viz: Student Edition.
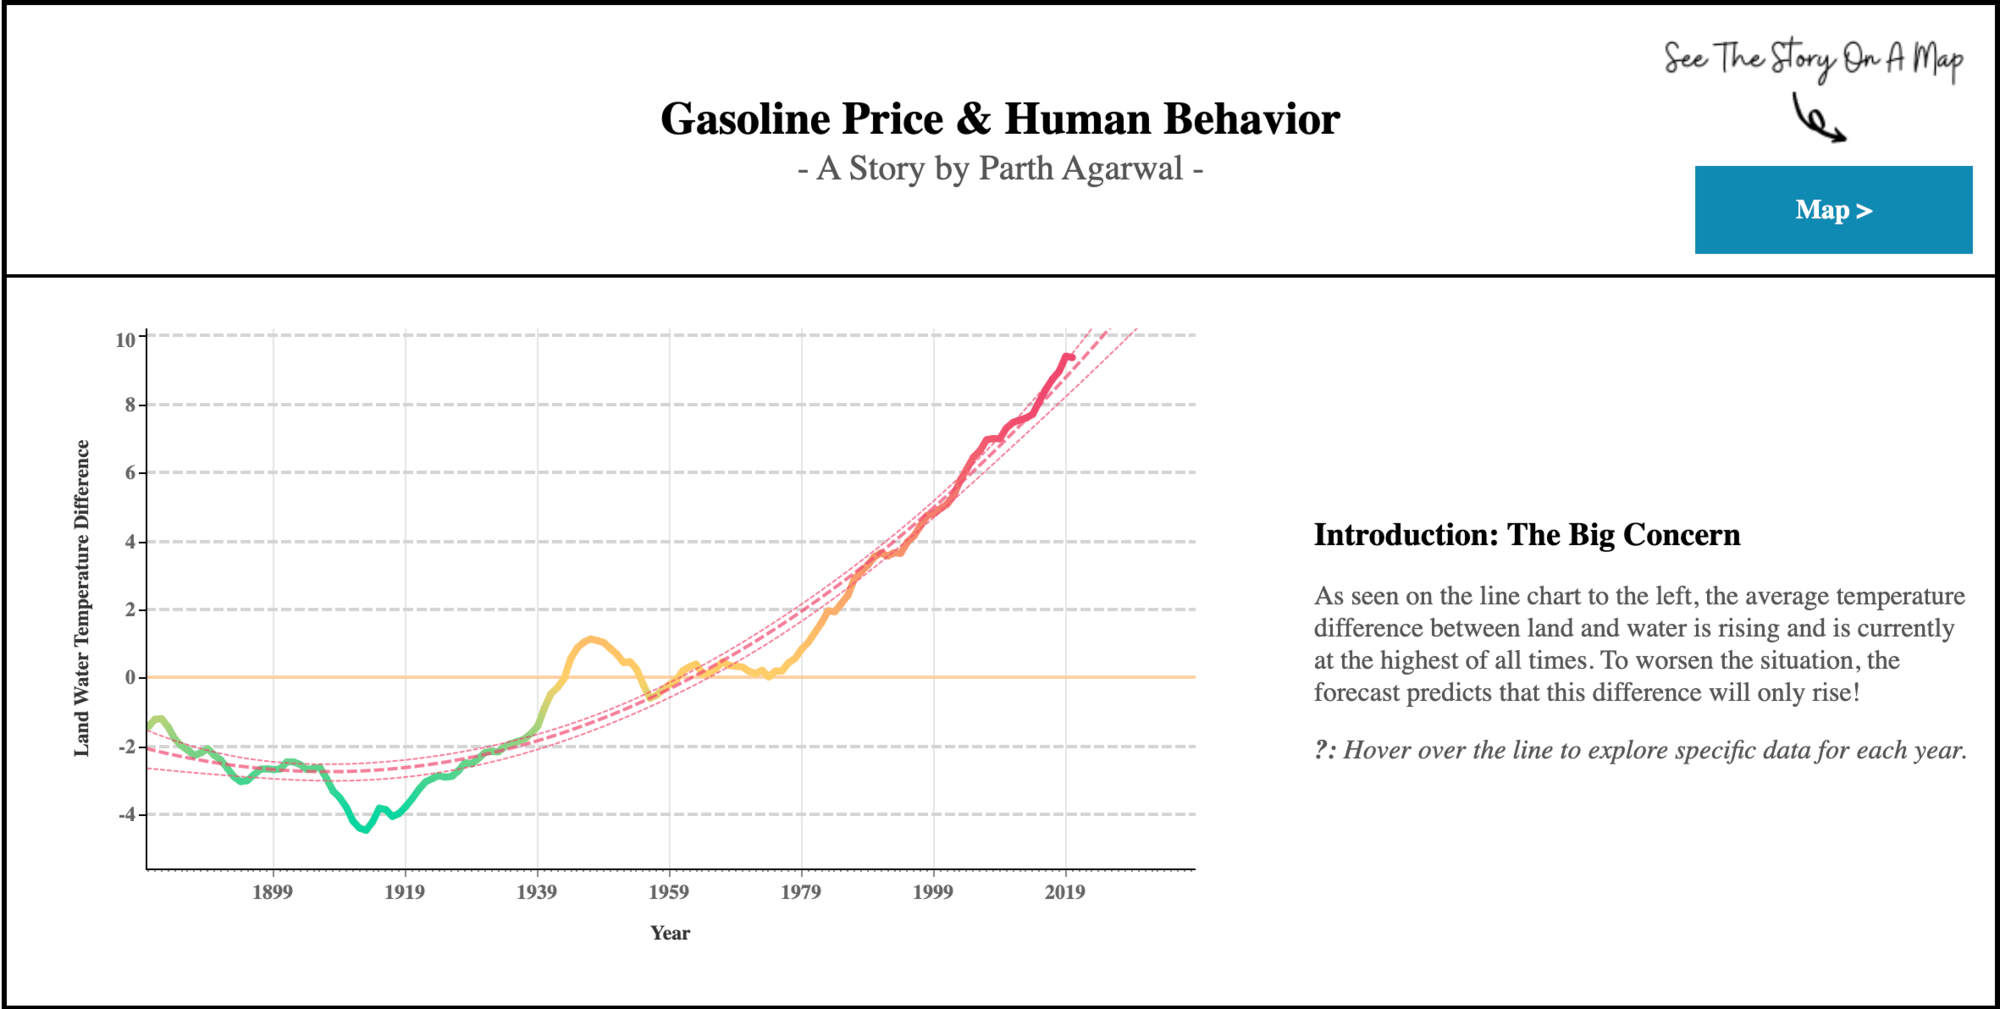
Parth Agarwal’s winning viz from the 2020 Tableau Public Iron Viz: Student Edition. [Parth Agarwal/Tableau Public]
“I remember being a graduate student at the University of Arizona in a portfolio management class that was co-led by a former student,” Christian said. “I enjoyed the class, and wanted to do something like that in the future. As my career trajectory took me deeper into analytics and data visualization—and as my proficiency and expertise grew—I sensed the desire to give back and 'pay-it-forward' by helping others out.”
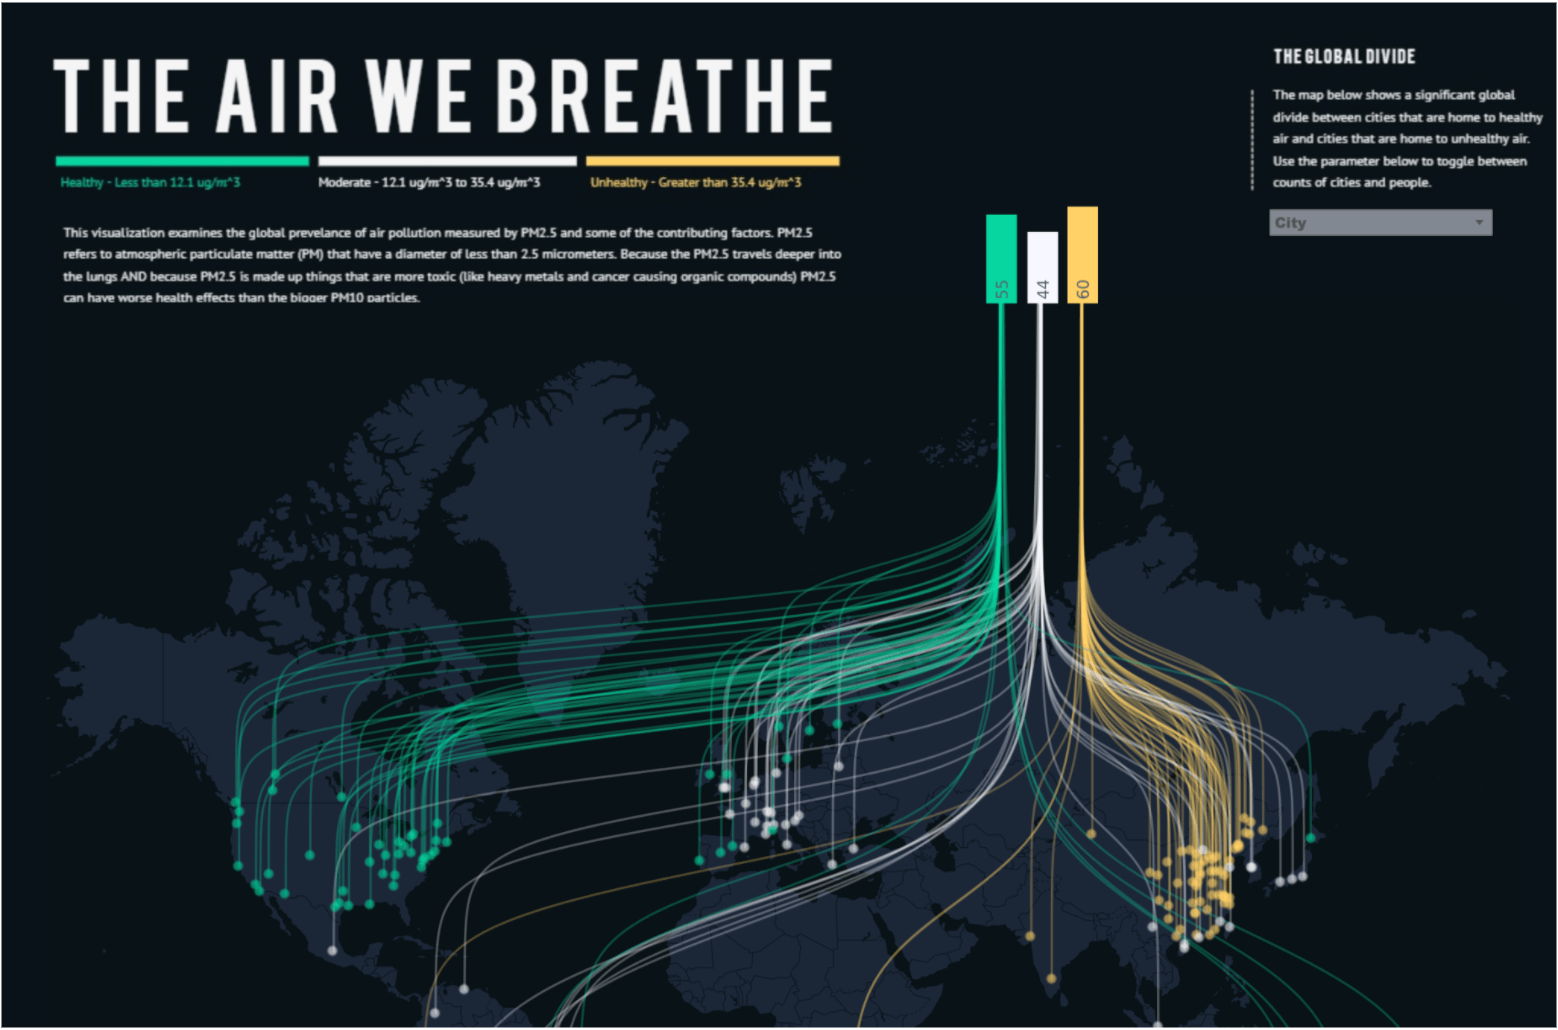
Winning viz from the 2020 Iron Viz Championship by Eller alum and current Tableau lead solutions engineer, Christian Felix. [Christian Felix/Tableau Public]
Eller offers free Tableau workshops, several led by former students, as part of its Technology Workshop Series, Level Up. Tableau is also the primary data visualization software used for Eller’s Tech Core summer internship. Tech Core has served nearly 200 students who wanted to build their data skills or lost internships due to COVID-19.
Because the business faculty at Eller know that students coming in from Gray’s pre-business course have Tableau experience, regardless of major, they can move beyond program fundamentals to add more advanced cases into their courses. In master’s degree programs, for example, Tableau tutorials are incorporated into the full-time introductory and executive MBA courses and the Business Analytics Masters Curriculum. Other faculty in marketing, accounting, and economics are taking notice and incorporating Tableau data visualization assignments into their courses, too.
Data skills for the resumé—and the real world
Tableau skills have helped students land internships and jobs. Eller encourages its students to use Tableau Public and link to it from their resumes to showcase their data skills to potential employers. According to Gray, at least a dozen former students have discussed Tableau in job interviews, and because they published vizzes on Tableau Public, they were able to share their profiles with employers.
For Tableau-intern-turned-employee, Kelly Nesenblatt, Tableau was vital to post-college life.
“Early into my college career, Tableau wasn’t a part of U of A’s core curriculum, but several members of Eller’s undergraduate statistics team believed in the product and taught it to students anyway,” Kelly said. “During these classes, I realized I could be creative and analytical. As I dived deeper into the platform, I fell in love with the possibilities it held.”
University of Arizona alum and Tableau intern-turned-employee, Kelly Nesenblatt.
Gray starts the first day of class showing students the famous 2017 Economist article, “The world’s most valuable resource is no longer oil, but data.” With the rapid speed of technology, including artificial intelligence and machine learning, Gray believes that businesses and employees who aren’t comfortable using data are “all but guaranteed to get lapped by the competition.”
The next step is offering students an Eller Tableau Badge/Certification, which would require completing several faculty or industry created tutorials and passing a lower-level test. Badging is popular because university students love being rewarded, said Gray, and employers like to see tangible proof that candidates have achieved a level of proficiency with the platform.
“I hear over and over from potential employers that they have so much data and so few people comfortable working with it, extracting valuable insights, and using it to make informed decisions,” Gray said. “Firms that recruit and retain data-savvy employees are much more likely to be successful.”
Kelly, for one, attests that data skills have shaped the early trajectory of her career. “Using the product, without a doubt, encouraged me to work for Tableau,” Kelly said. “I’m a true Tableau evangelist because I saw firsthand the difference it makes in a student’s career path.”


