Students—Use These 3 Data Best Practices to Take Your Skills to the Next Level


Data visualization skills are more important now than ever before and practicing these skills will prepare you for your career. Tableau’s Senior Curriculum Strategy Manager, Sue Kraemer helps to break down best practices for data visualization tips into 3 parts. Use these steps to help guide you through your vizzing process.
Part 1: Ask the Right Questions
The first step is to discover the right questions for your data. I always start here with students. I like to reference a quote from Albert Einstein, “if I had an hour to solve a problem I'd spend 55 minutes thinking about the problem and five minutes thinking about solutions”. Knowing the problem, the data, and resources that you have is essential to solving any problem. Knowing what direction to pursue involves multiple ‘lessons’:
- Be unafraid to play and explore! Get your hands in the data. To quote Dr. Nairanjana Dasgupta from our data literacy session at Tableau Conference ‘21, “I always tell my students, you have to touch and feel data. Otherwise, you will never realize and understand the nuances of it–the details–the little things that make it fun.”
- Draw it out and get creative. When doing any statistical analyses, visualize the data and make sure that you are performing the appropriate analysis. Many textbooks will describe Anscombe’s Quartet (image shown below) that Francis Anscombe described in a 1973 publication. All four sets of data give the same correlation value and linear regression equation! Viewing your data is important when making decisions on the appropriate model to use in your analyses. For a deeper dive on Anscombe’s Quartet, watch Technical Evangelist Director Andy Cotgreave’s video on why we visualize data.
- The discovery process is iterative! As you’re analyzing and visualizing your data, you may realize that you need to be asking a different question—or the same question in a new way. Be flexible to this change, and open to beginning the process again.
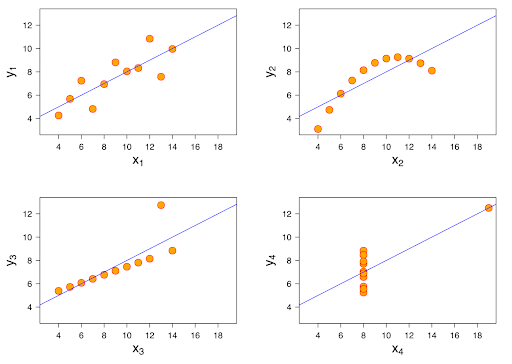
Anscombe’s Quartet. Franscis Anscombe published “Graphs in Statistical Analysis” in 1973. It is crucial to visualize your data when conducting data analysis. See Anscombe’s Quartet blog
Part 2: Present Your Findings
Now that you’ve asked the right questions and dove deep into analysis - it’s time to bring the data to life through data visualization. Below are a few things to keep in mind.
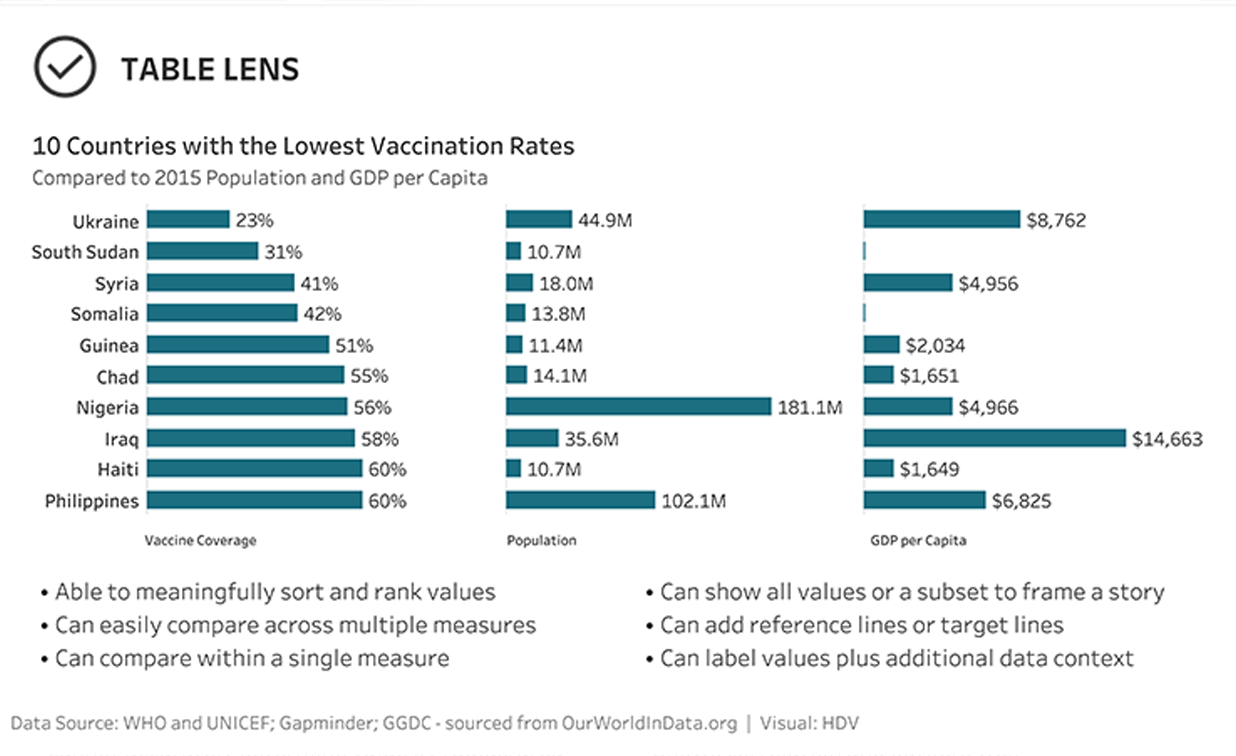
- Consider your chart types. When creating your viz, bar charts are a great place to start. They are versatile, easy to interpret, and can answer many questions in visual analysis. While there are other visualization formats that may seem more visually creative, choosing the right type of visualization is critical to your analysis. It relies on considering many things: the purpose of your analysis, the data you want to display, and the needs of your audience. To dive deeper into chart types, and how they’re used, check out Tableau’s A Guide To Charts. For another reference, see Tableau Community member and Co-Founder of HealthDataViz, Kathy Rowell’s helpful graphic that highlights the do’s and don’ts of when to use each visualization below.
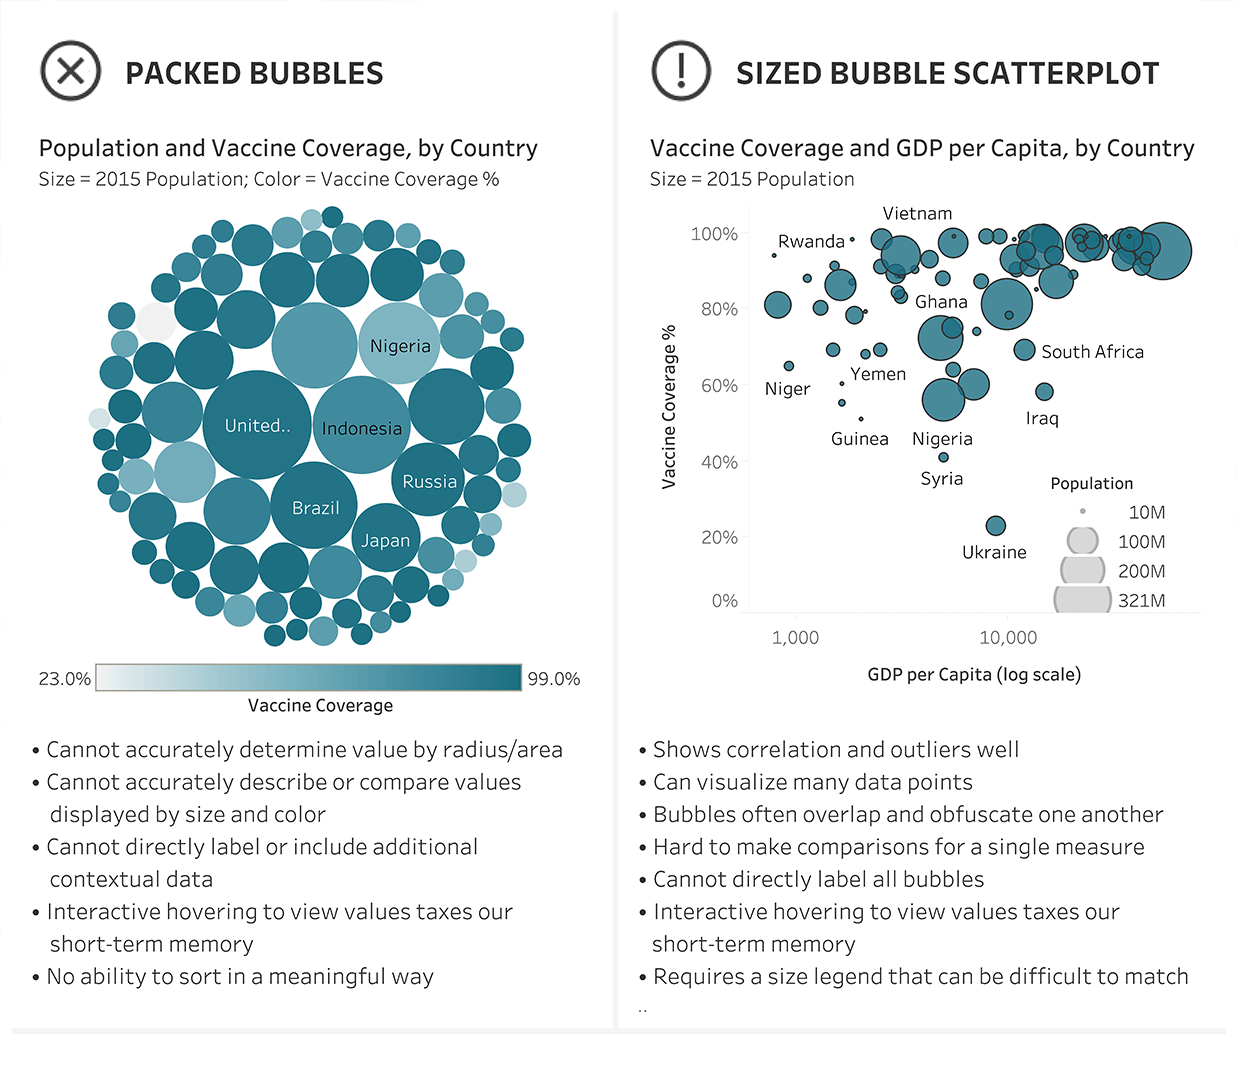
In, Visualizing Health and Healthcare Data, Katherine Rowell, Lindsay Betzendahyl, and Cambria Brown share alternative visualizations to use instead of packed and when to cautiously use sized bubble scatter plots.
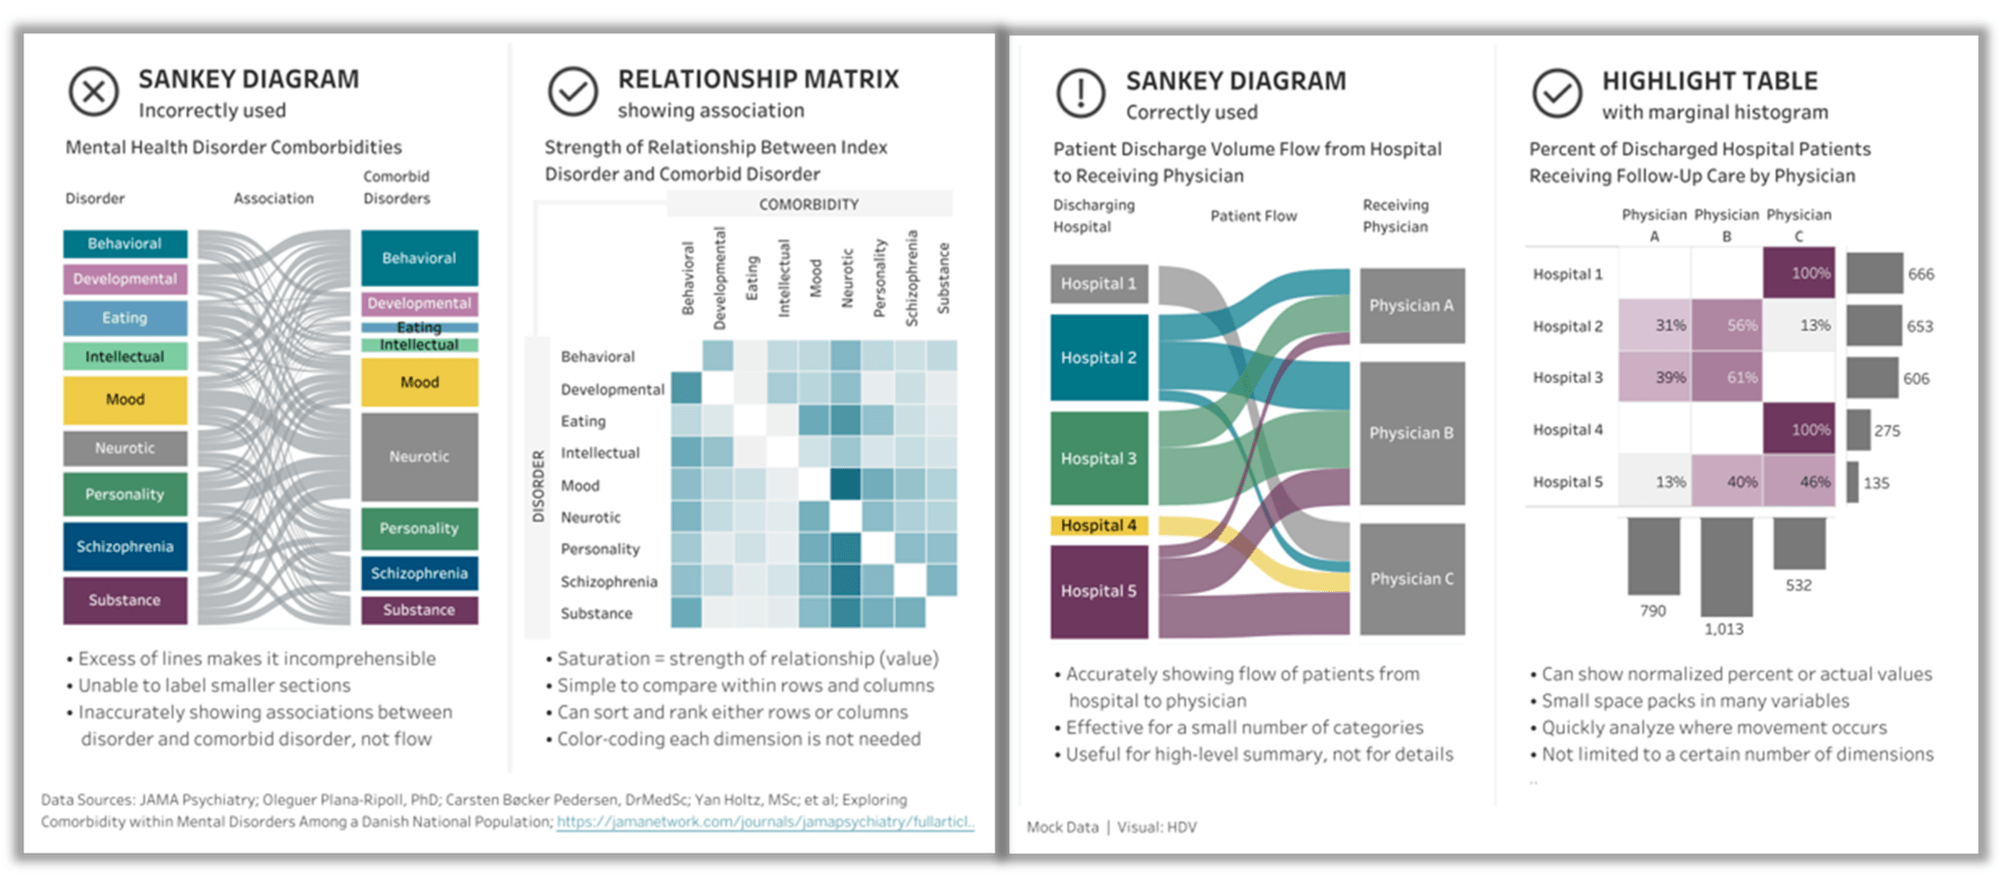
Katherine Rowell and team share how and when to properly use a Sankey diagram and give us better alternatives to use instead. (Source: Visualizing Health and Healthcare Data, Katherine Rowell, Lindsay, Betzendahl, and Cambria Brown (2020) Wiley)
- Make sure your visualizations are following best practices: Before presenting your visualizations (and when you read charts that you encounter), double-check that best practices are being followed and the appropriate conclusions are being shown. Use a checklist, such as the SCAM checklist, to be confident that you are showing the best results!
- Look at your visualization through an inclusive lens: It’s important to remember we all share a responsibility to ensure the language, symbols, and point of view we use in our data stories represent the diverse world that we live in. The Do No Harm Guide from the Urban Institute is grounded in the belief that we can work together to build a more inclusive world by using data with sensitivity and care. Use this guide and apply your learning with the Equity and Inclusion Guidelines for Data Visualization Trailhead to help you build an equitable approach to data and data visualization.
Part 3: Tell a story
You’ve done the work, analyzed the data, created your visualizations and now it’s time to wrap it all up and tell your data story. I connected with Andy Cotgreave, and Jock Mackinlay, Technical Fellow and Iron Viz judge, to discuss how Iron Viz contestants told great stories. Andy shared, “an effective data story uses titles and labels. Research shows that our eyes are drawn first to titles, and thus it's imperative that your title begins the story. Perhaps it is in the form of a question, inviting the user to explore the visualization to find an answer. Or perhaps it's a strong statement, describing the findings that are shown. Always remember that your job is to guide the user through your work. Titles must thus grab attention, and labels can help draw attention to key marks that support your story”.
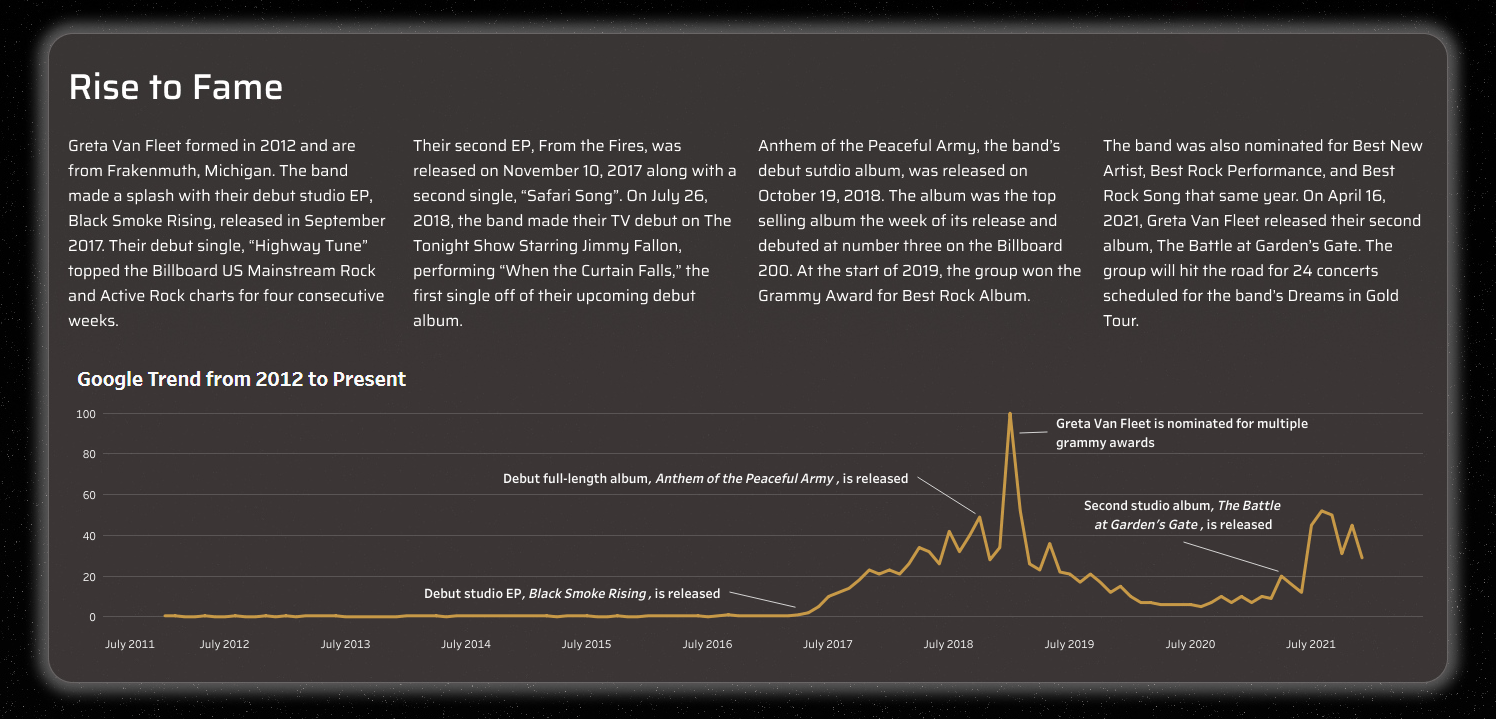
Check out one of 2021’s Student Iron Viz winner Michael Dunphy’s Viz on Greta Van Fleet. Notice how Michael’s titles, labels, and text guide the reader in understanding clearly the analyses being done and the conclusions being made.
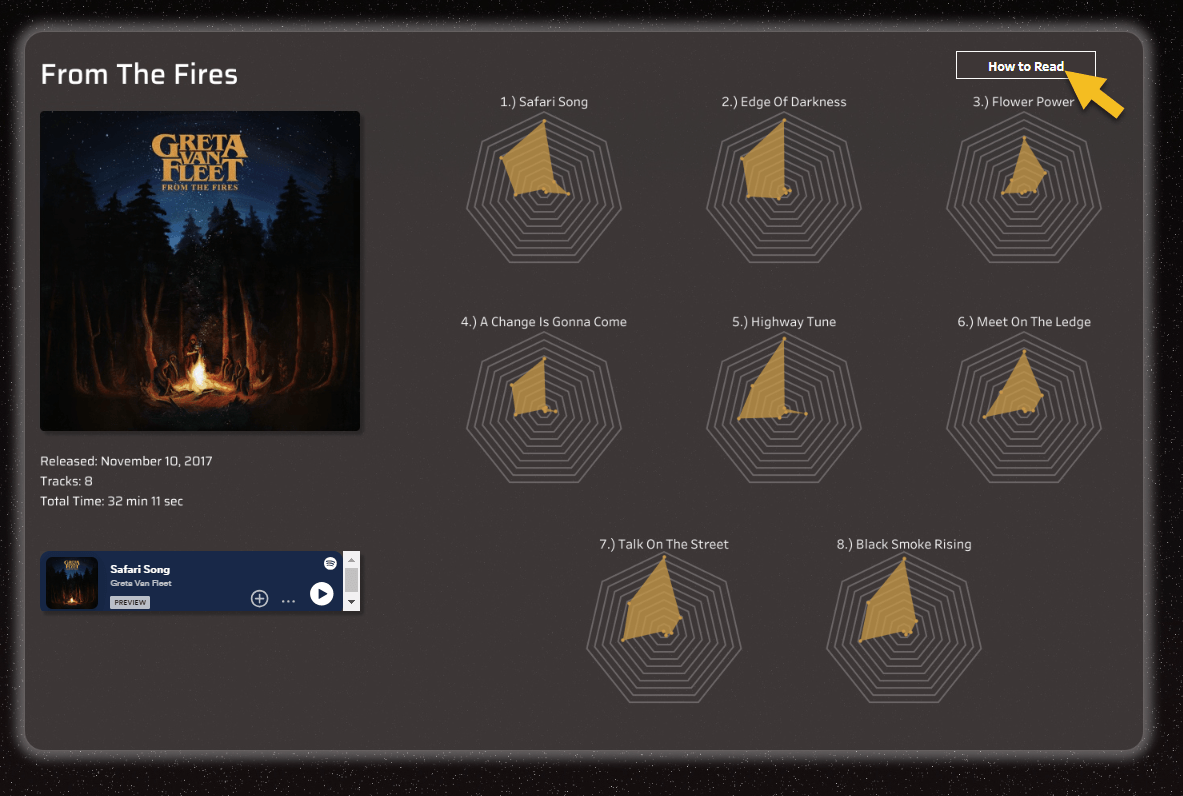
While we cautioned above about using ‘creative viz types’, there are times when not commonly used visualization types are a good choice. When you do use a more uncommon visualization type, make sure that you give your reader instructions on how to properly read the viz. In the following viz using radar charts, (an uncommon chart type), Michael provides instructions on how to read the chart.
Finally, Jock sums up storytelling as “an effective data story starts with a clear question. It then has a sequence of logical steps that lead to a finding." Use this sentence as your final guide throughout the data visualization process.
Additional Resources

- Iron Viz: Student Edition 2024 is in full swing, and there’s still time to create your visualization and submit before the January 1, 2024 deadline. Use these data best practices as you create the winning viz!
- A Guide To Charts
- Build Your Data Literacy from Trailhead
- Equity and Inclusion Guidelines for Data Visualization Trailhead
- Do No Harm Guide
- Cycle of Visual Analysis
- Blog post: Create a compelling Iron Viz Qualifier entry in 10 steps
関連ストーリー
Learn the Basics of Well-Structured Data
 2024/12/06

What is Iron Viz: Student Edition?
 2024/11/27

Tableau for Teaching: Free access and resources to teach Tableau
 2024/11/03