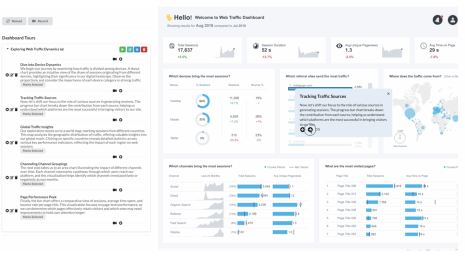
Stepping through Charted Territory: Creating Interactive Step-by-Step Dashboards Tours
 Nicole Sultanum
2025/06/08
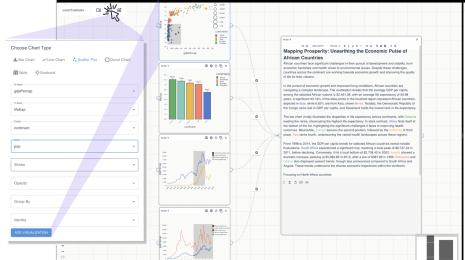
Visualize, Narrate, Repeat: Closing the Loop on Data Storytelling
 Denny Bromley
2025/06/02
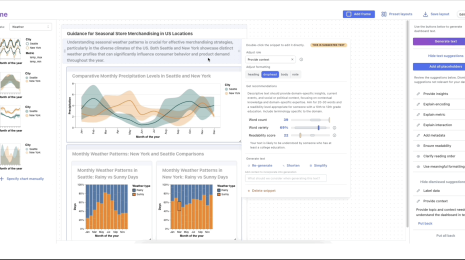
Co-Authoring Dashboard Text with AI
 Nicole Sultanum
2025/05/29
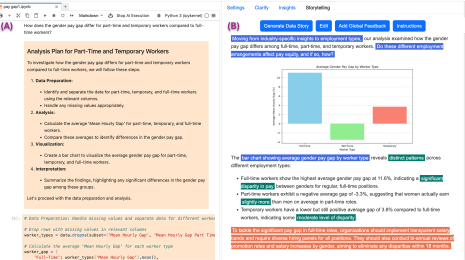
Unlocking Actionable Insights with Jupybara: A Multi-Agent AI Assistant for Data Analysis and Storytelling
 Vidya Setlur
2025/05/23

AI-Assisted Authoring of Text and Charts for Data-Driven Communication
 Arjun Srinivasan
2025/04/04

Beyond the Default: Customizing Automated Data Insights with GROOT
 Vidya Setlur
2024/10/24

Beyond the Visuals: Elevating Text as a First-Class Citizen in Dashboard Design
 Nicole Sultanum
2024/10/16

Exploring Data Uncertainty through Speech, Text, and Visualization
 Vidya Setlur
2024/08/09

Exploring Spatial Computing and Immersive Analytics with Vision Pro
 Vidya Setlur
2024/07/31
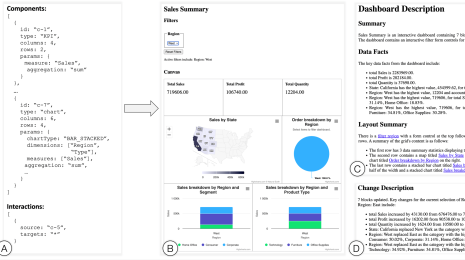
Designing Accessible Dashboards for Screen Reader Users
 Arjun Srinivasan
2023/12/01
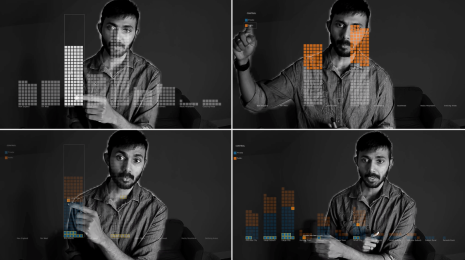
Adding Speech Interaction to Tableau Gestures
 Matthew Brehmer
2023/11/17
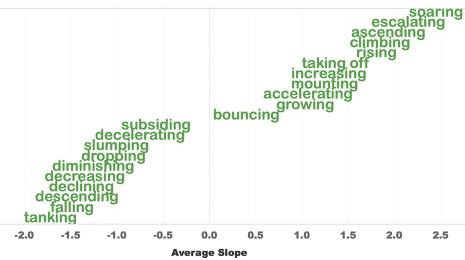
Quantifying Semantic Labeling of Visual Features in Line Charts
 Denny Bromley
2023/10/25
Research & Development