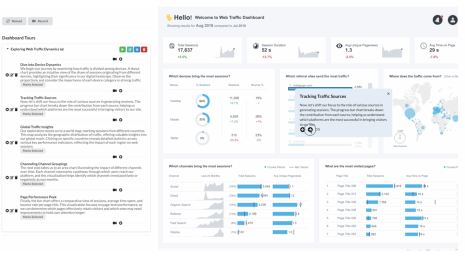
Stepping through Charted Territory: Creating Interactive Step-by-Step Dashboards Tours
 Nicole Sultanum
มิถุนายน 8, 2025
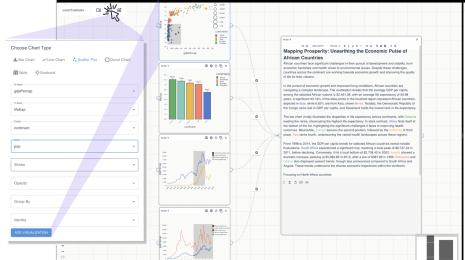
Visualize, Narrate, Repeat: Closing the Loop on Data Storytelling
 Denny Bromley
มิถุนายน 2, 2025
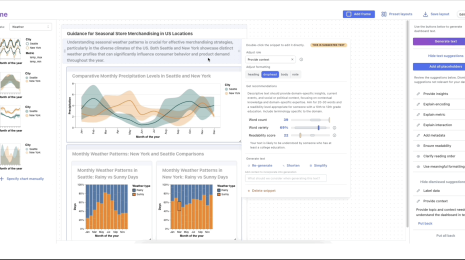
Co-Authoring Dashboard Text with AI
 Nicole Sultanum
May 29, 2025
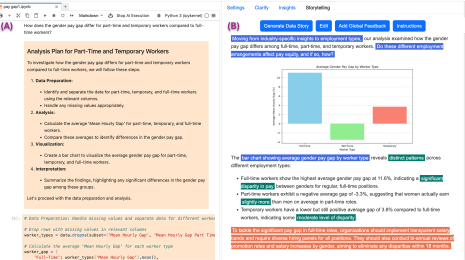
Unlocking Actionable Insights with Jupybara: A Multi-Agent AI Assistant for Data Analysis and Storytelling
 Vidya Setlur
May 23, 2025

AI-Assisted Authoring of Text and Charts for Data-Driven Communication
 Arjun Srinivasan
เมษายน 4, 2025

Beyond the Default: Customizing Automated Data Insights with GROOT
 Vidya Setlur
ตุลาคม 24, 2024

Beyond the Visuals: Elevating Text as a First-Class Citizen in Dashboard Design
 Nicole Sultanum
ตุลาคม 16, 2024

Exploring Data Uncertainty through Speech, Text, and Visualization
 Vidya Setlur
สิงหาคม 9, 2024

Exploring Spatial Computing and Immersive Analytics with Vision Pro
 Vidya Setlur
กรกฎาคม 31, 2024
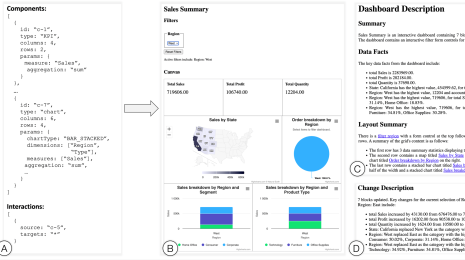
Designing Accessible Dashboards for Screen Reader Users
 Arjun Srinivasan
ธันวาคม 1, 2023
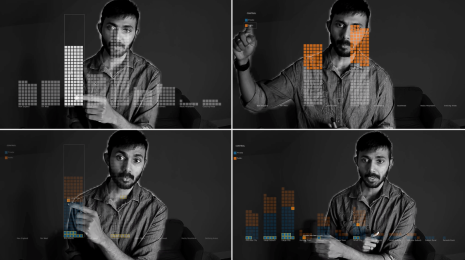
Adding Speech Interaction to Tableau Gestures
 Matthew Brehmer
พฤศจิกายน 17, 2023
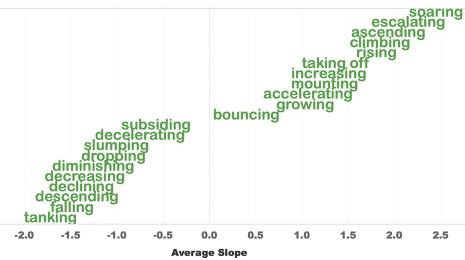
Quantifying Semantic Labeling of Visual Features in Line Charts
 Denny Bromley
ตุลาคม 25, 2023
Research & Development