Who are the finalists of the 2023 Iron Viz Qualifiers?
The 2023 Iron Viz Qualifier Contest results are in, and once again, our judges had no easy task. This year’s theme was games. Data sets and visualizations could be anything from esports and video games to sports, board games, and more. It was inspiring to see the wide variety among the 200+ submissions. But alas, only three get to advance to the Iron Viz Championship at Tableau Conference in 2023. Who are these talented data storytellers? Read on.
Iron Viz Qualifier judging
We asked Tableau Ambassadors, Visionaries, and past Iron Viz finalists to help us narrow down all the incredible vizzes to the Top 15, which include seven first-time entrants! Entries were scored according to the following criteria:
Design: How appropriate is the design for the story being told?
Storytelling: Is a clear story being told or a question being explored, and is there appropriate context?
Analysis: How sophisticated and appropriate is the data that is being used for the story?
Submissions were separated into three geographical regions to ensure diversity: AMER, EMEA, and APAC. The highest scoring viz in each are our finalists, with the following four vizzes per region chosen as runners-up.
Thank you to our community judges: Greg Barlin, Brandi Beals, Simon Beaumont, Irene Diomi, Fraser Gallop, Roshni Gohil, Nisa Marques, Alice McKnight, Adam Mico, Sean Miller, Samuel Parsons, Amitesh Patara, Prasann Premm, Annabelle Rincon, Alex Waleczek, Mo Wootten
Who did the judges determine as the top 15 Iron Viz visualizations?
The Iron Viz Qualifier is a challenging endeavor. Participants spend weeks sourcing and preparing their own data, trying new techniques, and pushing their skills to the limits to create the ultimate visualization and share the story behind it. We are incredibly proud of their dedication and amazed by their accomplishments. Check out the top entries below, and you can explore all of this year’s entries here. You can also watch a recap of the Tableau Community Iron Viz Top 15 Finalist Announcement led by the championship co-host, Tableau Lead Solutions Engineer Archana Ganeshalingam, and Tableau National Solutions Engineer Mark Bradbourne.
The Unofficial Beginner’s Guide to the 2022 World Cup by Kim Tricker of Orlando, Florida, USA, breaks down the men’s international football competition—from tournament format to past winners and the players to watch.
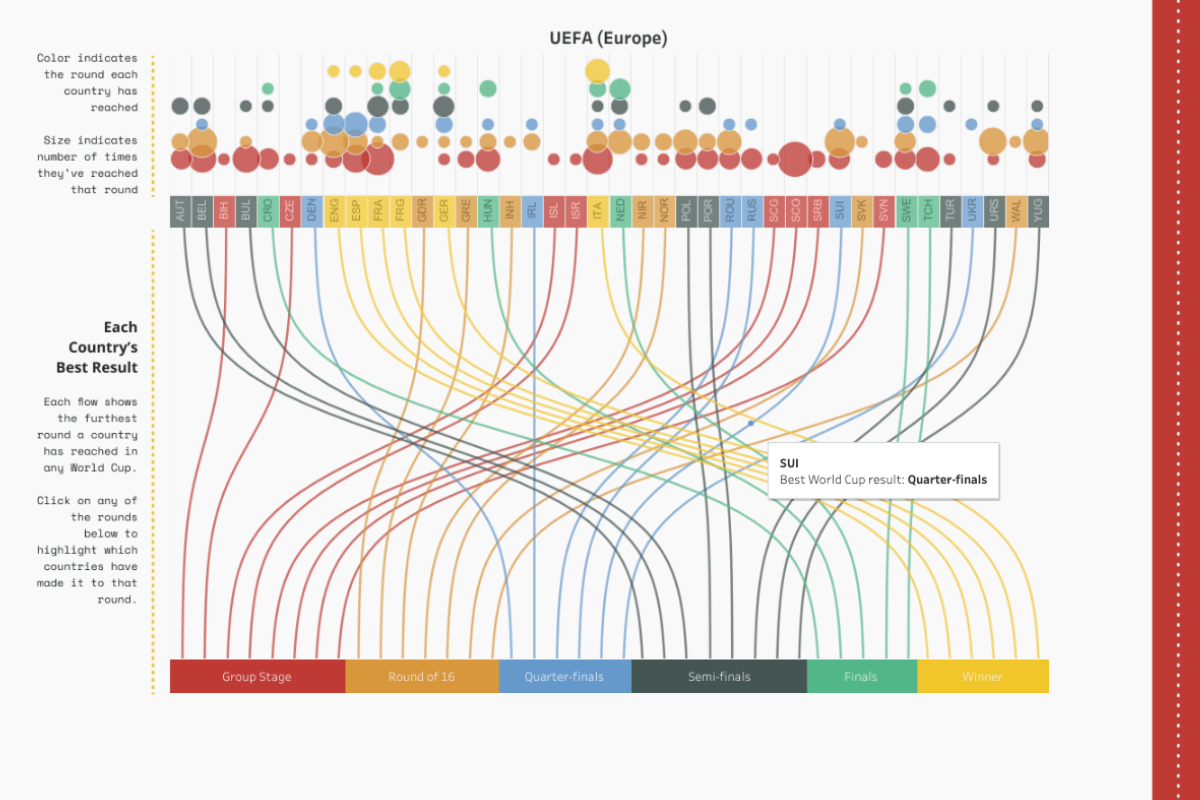
The Unofficial Beginner’s Guide to the 2022 World Cup by Kim Tricker
Mobile Legends | MLBB by Phyllis Tay of Singapore takes a deep dive into the popular mobile multiplayer online battle arena game—from heroes and roles to countering your opponent.
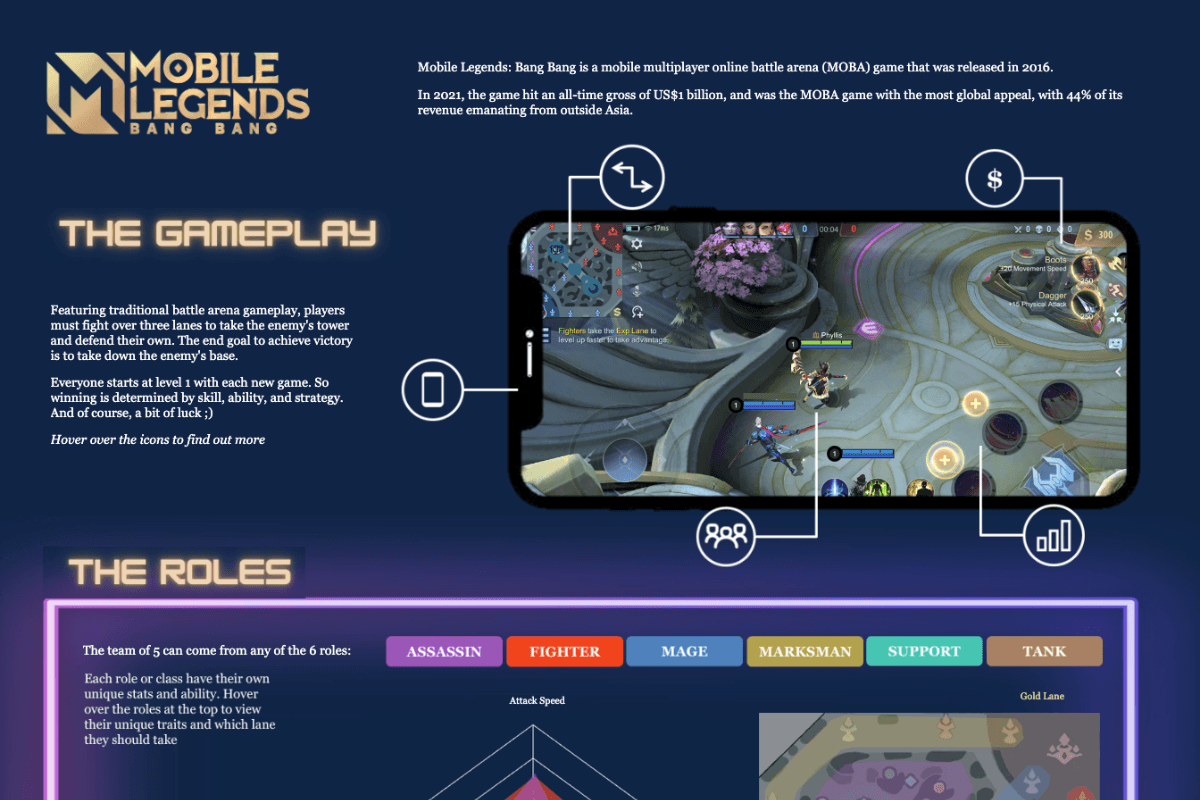
Mobile Legends | MLBB by Phyllis Tay
Jonny’s Drop: The Story of the 2003 Rugby World Cup Final by Chris Westlake of Edinburgh, Scotland, United Kingdom, explores the road to the 2003 World Cup final, where Jonny Wilkinson’s extra-time drop goal gave England a dramatic win.
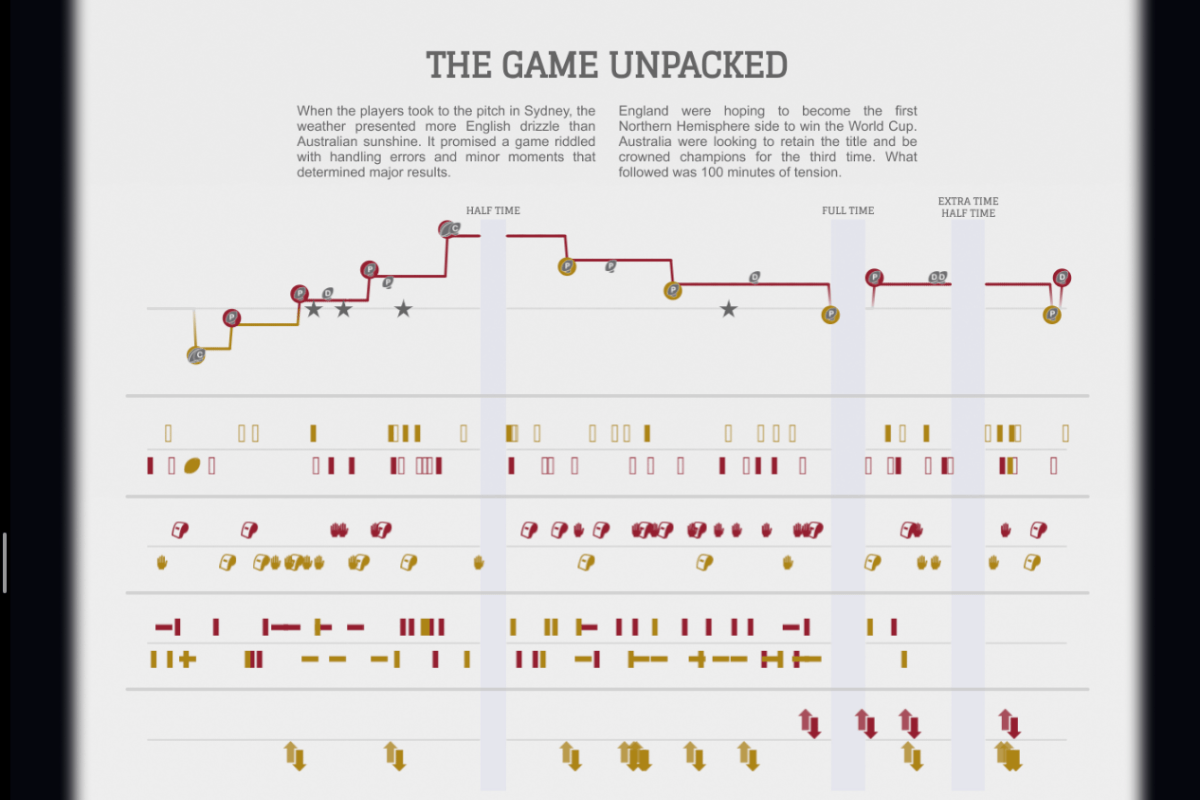
Jonny’s Drop: The Story of the 2003 Rugby World Cup Final by Chris Westlake
Fight in the Skies: A First World War Aerial Combat Game by Bo McCready of Austin, Texas, USA, highlights features of the game, personal connections, and the history of the real-life aviators who informed the design.
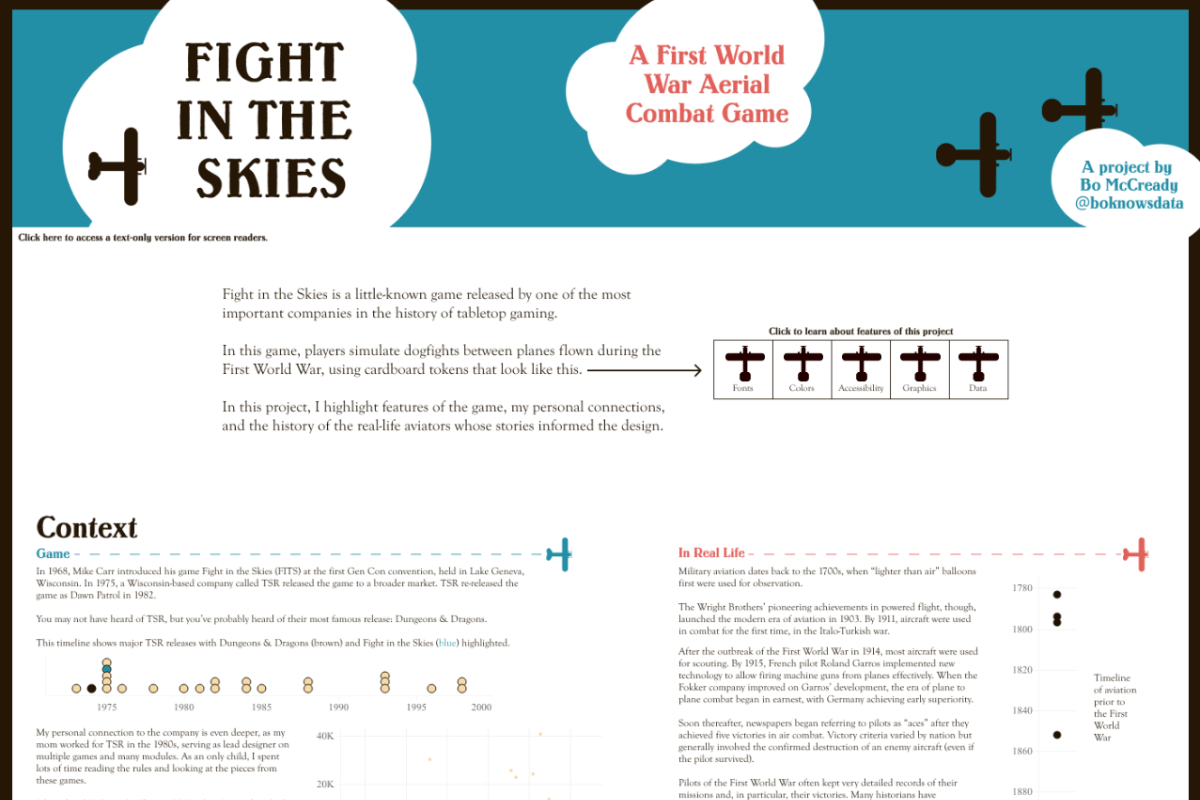
Fight in the Skies: A First World War Aerial Combat Game by Bo McCready
The Blazing of the Trail by Darragh Murray of Brisbane, Queensland, Australia, provides a guided tour of the evolution of participation by women in Australian Rules Football with an emphasis on the development of the AFLW.

The Blazing of the Trail by Darragh Murray
Does the Geek Rating mean anything? By Lorna Brown of Cheshire, England, United Kingdom, explores BoardGameGeek’s top and bottom 50 games to see how they compare to each other.
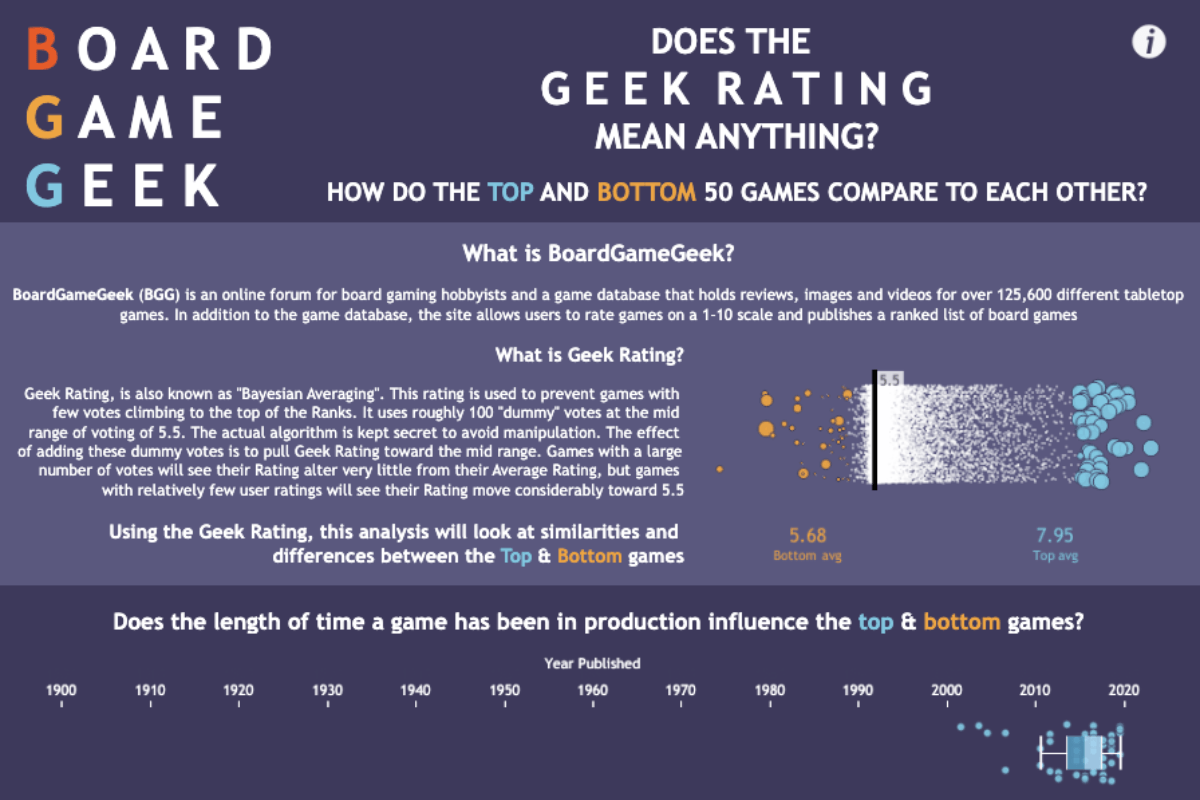
Does the Geek Rating mean anything? By Lorna Brown
Ascent - The Rise of Women in Rock Climbing by Nicole Klassen of Atlanta, Georgia, USA, examines percentages of women climbers, what drives them to participate in the sport, the performance gap, and more.
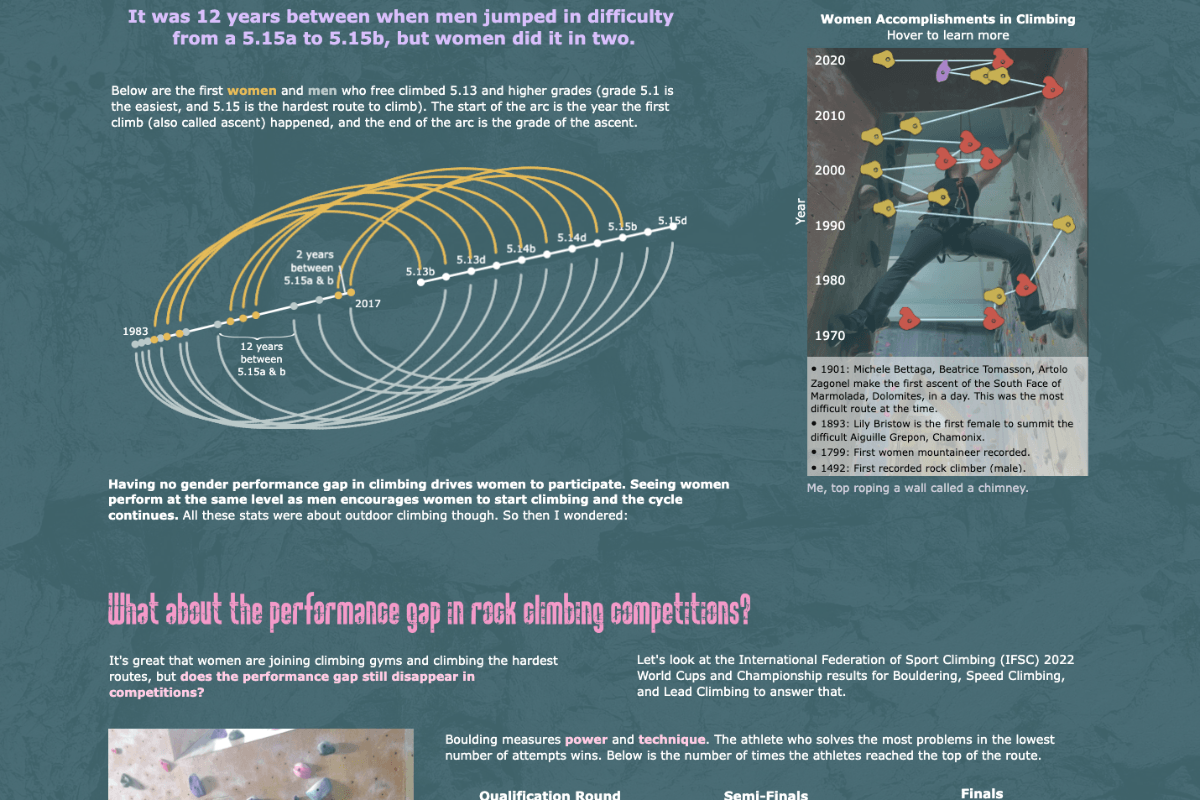
Ascent - The Rise of Women in Rock Climbing by Nicole Klassen
The Science of Winning by Varun Jain of Delhi, India, takes you on a journey to determine whether winning at chess—from the pieces and players to the tactics and strategy— is an art or a science.
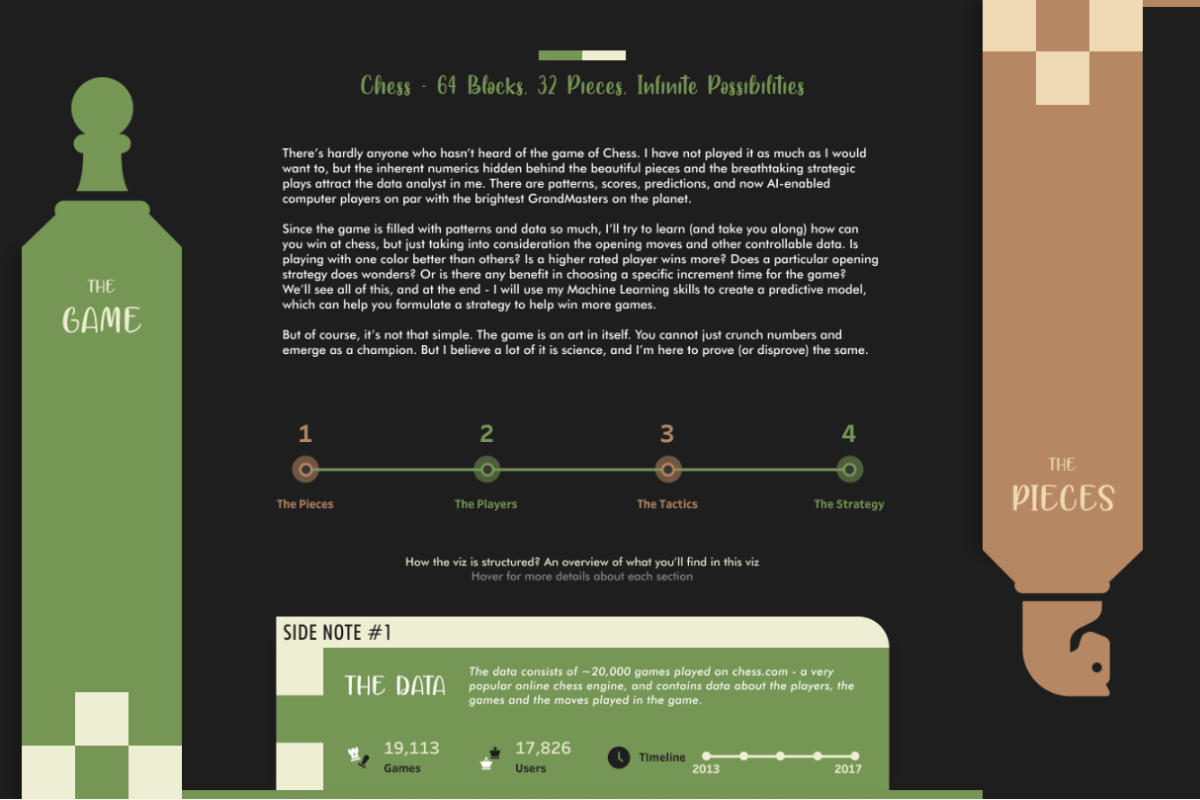
The Science of Winning by Varun Jain
Puzzle Hunts (Not Only) In Darkness by Tereza Fukátková of Slapy, Czech Republic, explores the game of puzzle hunting—where teams compete to solve a series of puzzles—in the Czech Republic.
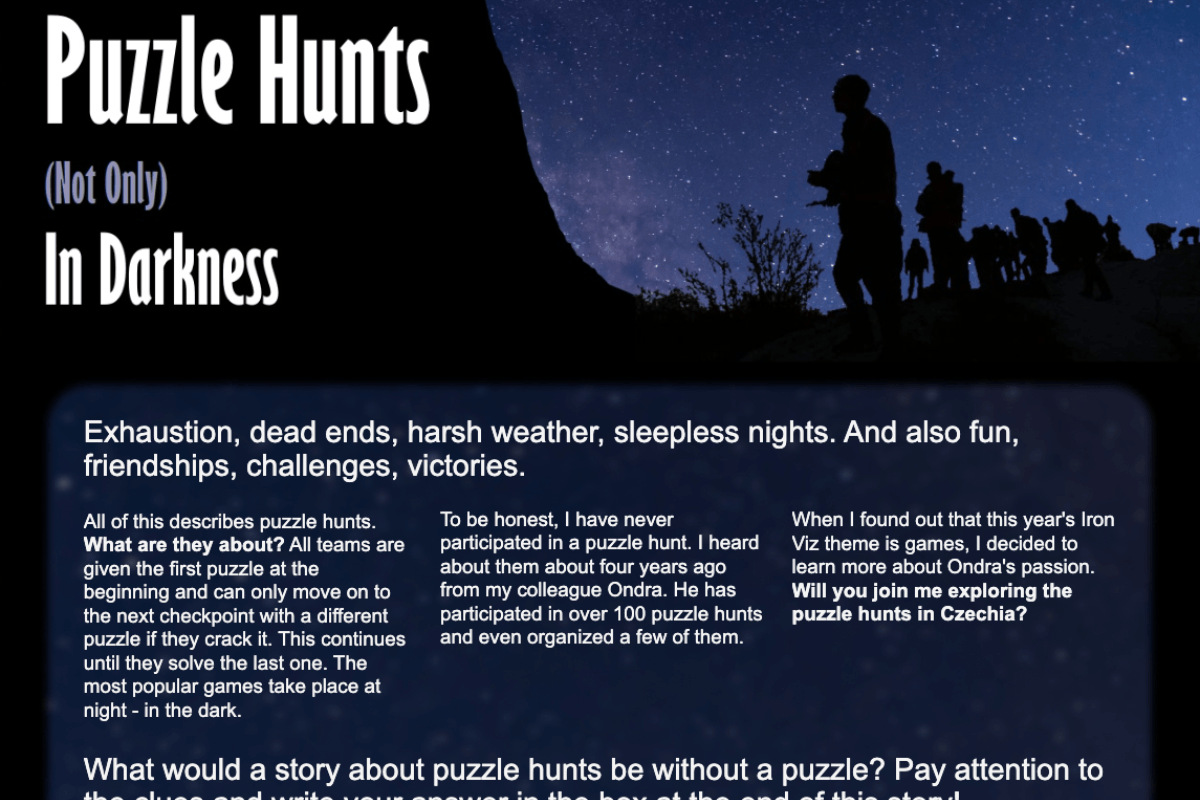
Puzzle Hunts (Not Only) In Darkness by Tereza Fukátková
(Nearly) A Year of Wordle: A Family Adventure by Agata Ketterick of Scarborough, Maine, USA, digs into the data of her own family’s daily Wordle challenge to determine the average number of guesses, letter frequency, word categories, and more.
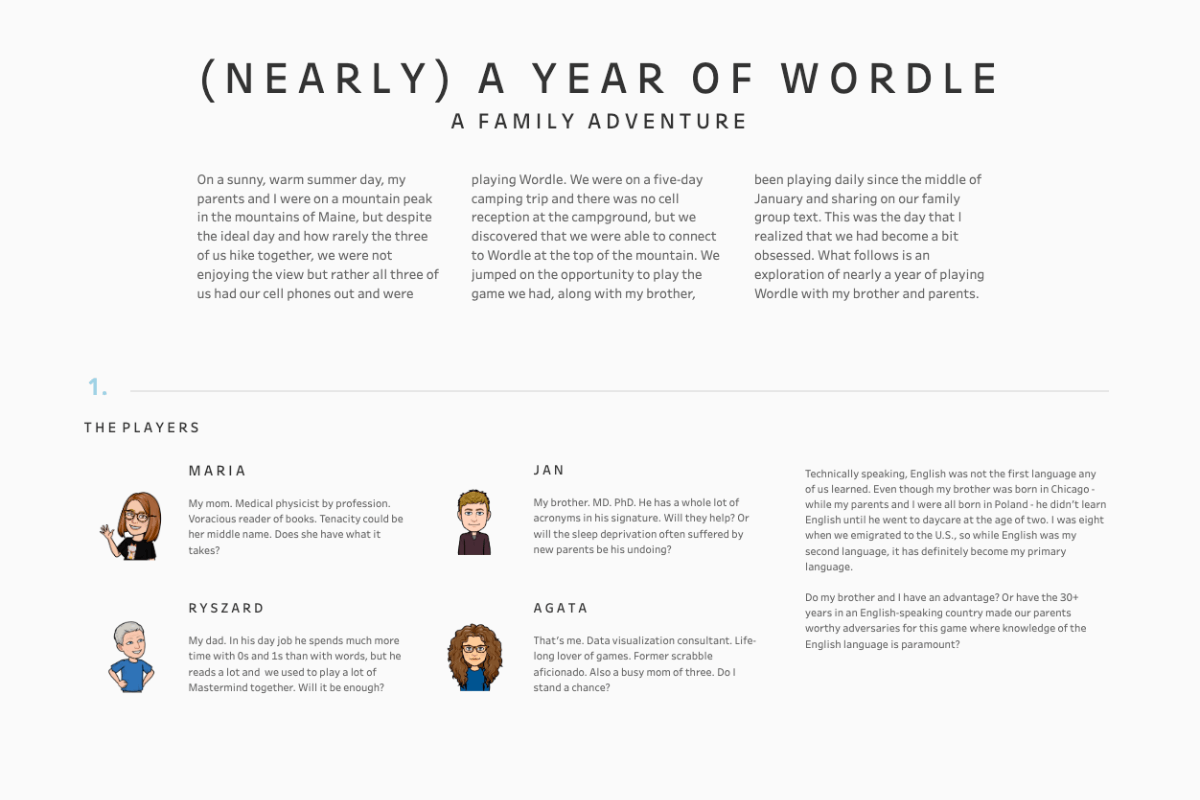
(Nearly) A Year of Wordle: A Family Adventure by Agata Ketterick
It was NEVER about the Dragons by Louis Yu of Singapore takes you on a journey into the World of Thedas in Dragon Age and shows how it became one of the most influential western role-playing games.

It was NEVER about the Dragons by Louis Yu
Olympic Games - 12 Facts about the Olympics by Nathalie Richer of Clichy, France, explores fun facts about the Olympics—name frequency, age, medals won, and more.
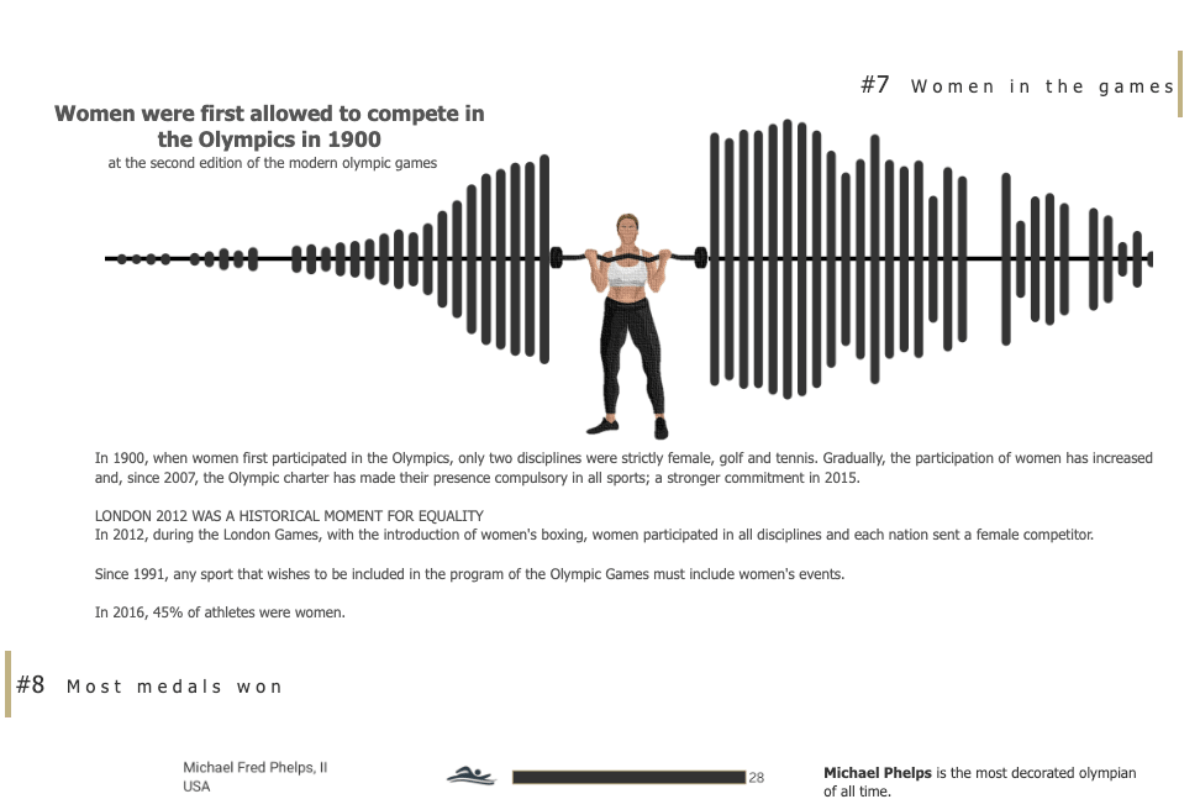
Ascent - The Rise of Women in Rock Climbing by Nicole Klassen
Give a round of applause to our three Iron Viz 2023 finalists moving on to the championship
Spiel des Jahres by Brittany Rosenau of Tavares, Florida, USA, demonstrates how an annual German competition recognizing outstanding games created in a given year can help you find your next favorite.
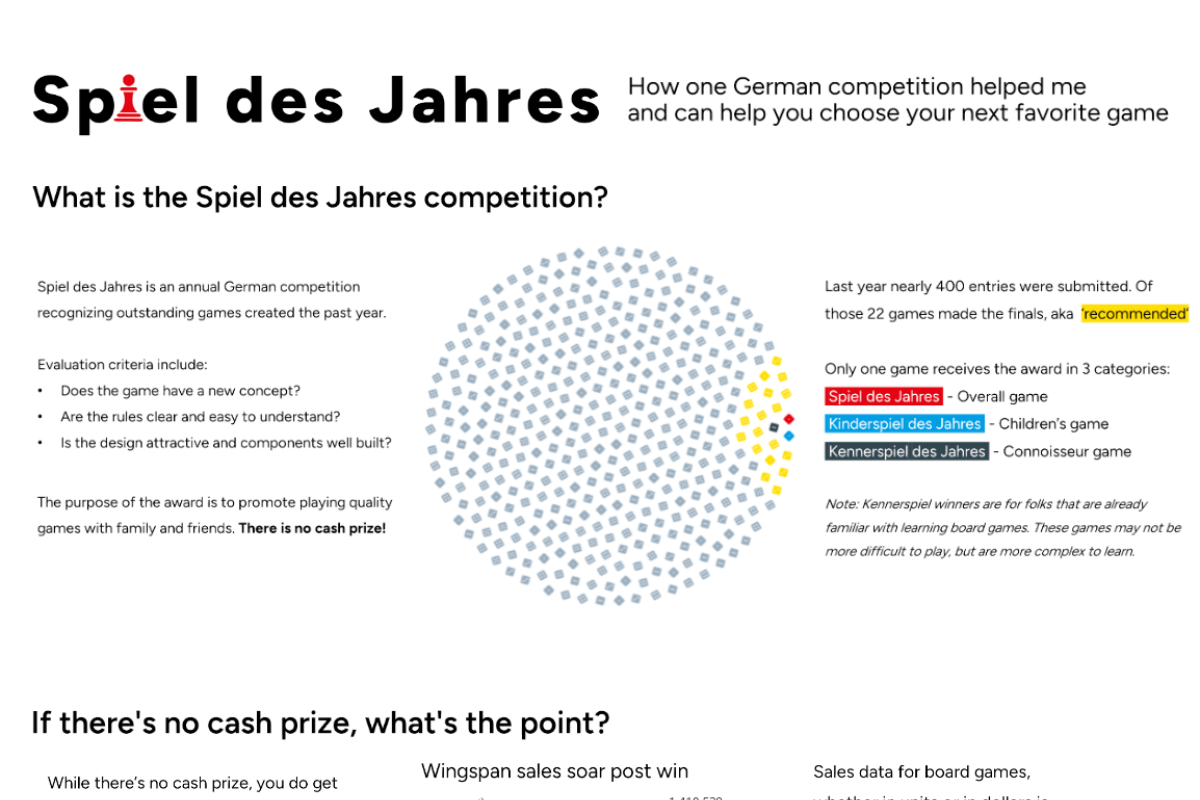
Spiel des Jahres by Brittany Rosenau
What’s The Best Board Game To Try Next? by Paul Ross of Surfers Paradise, Queensland, Australia, introduces Birthday Buzz, a simple metric that identifies an awesome short list of games from BoardGameGeek (BGG).
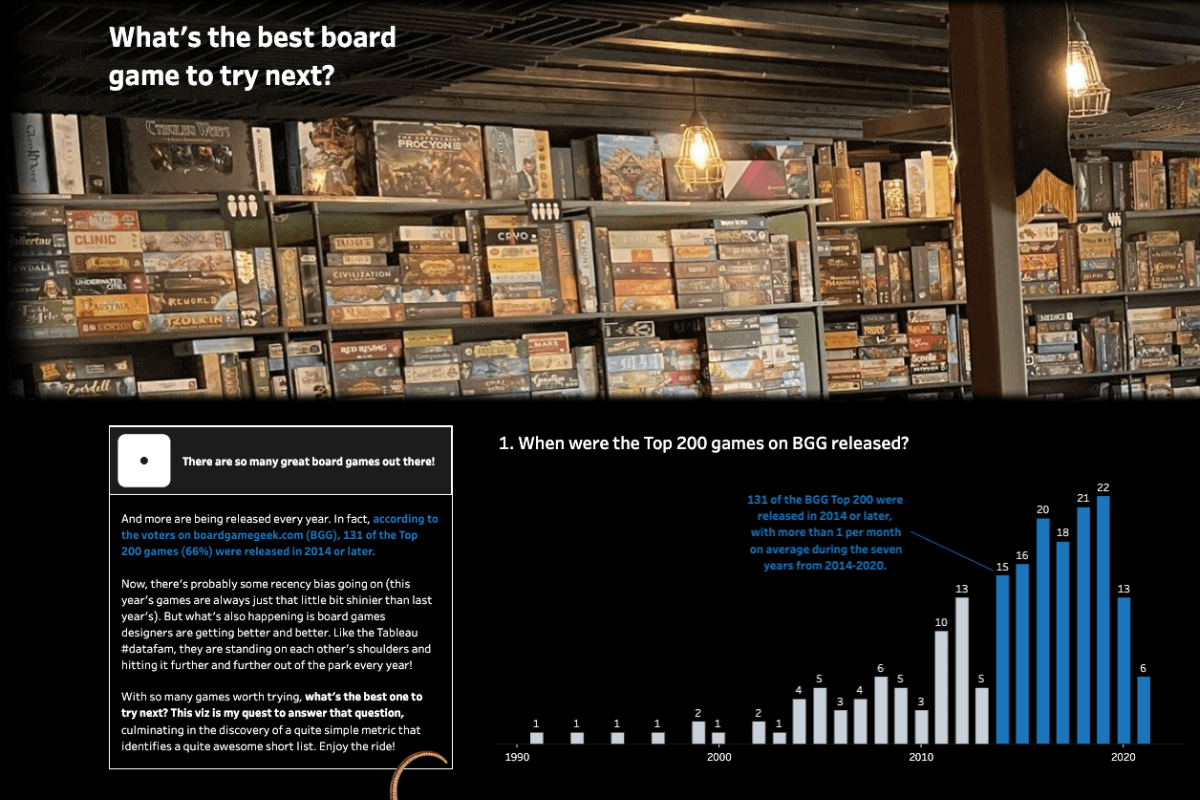
What’s The Best Board Game To Try Next? by Paul Ross
The Greatest Game Of All Time by Nirosh Perera of London, England, United Kingdom, examines the Wimbledon 2008 men’s singles championship match that pitted the then-top-ranked Roger Federer against second-ranked Rafael Nadal.
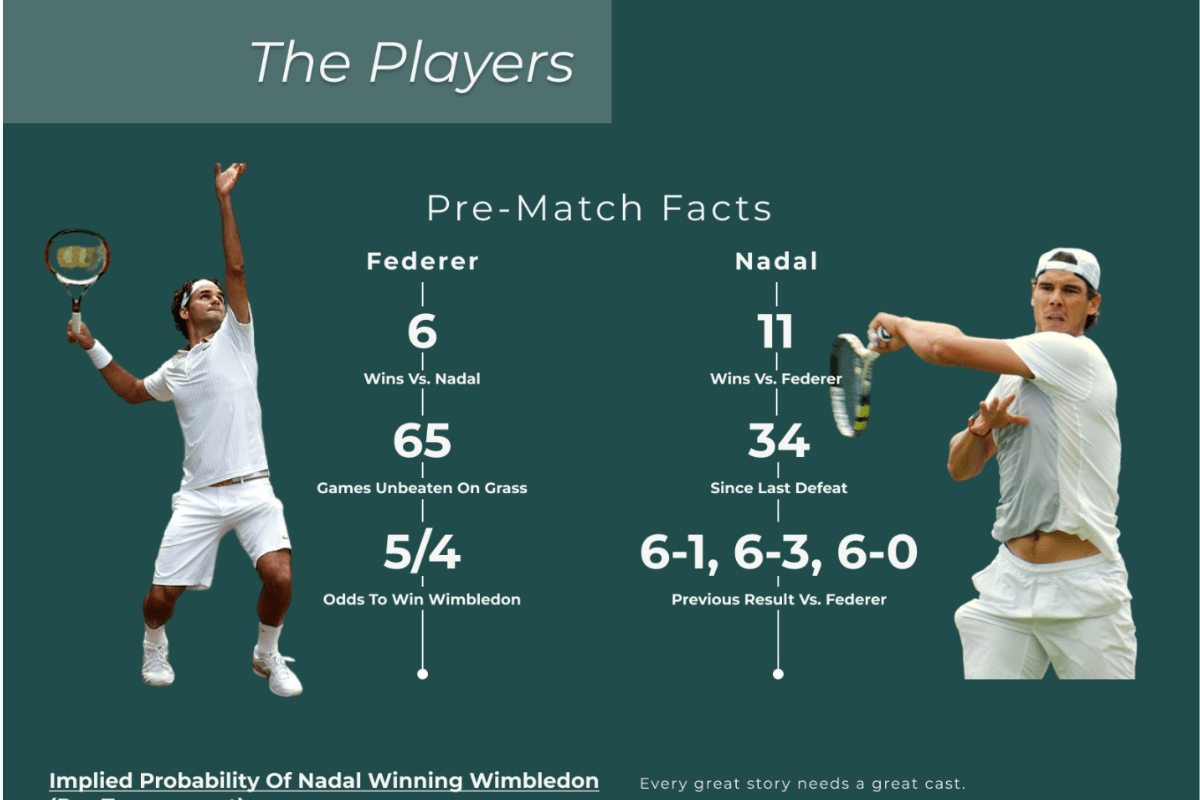
The Greatest Game Of All Time by Nirosh Perera
Congratulations to our viz-tastic finalists, and thank you to everyone that participated. Who will claim victory, bragging rights, and thousands of dollars in prize money for themselves and a charity of their choice? You’ll want to have a front-row seat at Tableau Conference 2023.


