DataFam Roundup December 2025


Welcome! Dig into this month's DataFam Roundup—a monthly blog that brings together community content all in one post. As always, we invite you to send us your content—and the DataFam content from your peers that have inspired you! To send us your content, join the Tableau Community workspace on Slack and join the #community-share channel.
Community Highlight
To recognize new and consistent Tableau contributors—we’re excited to have a section within the monthly DataFam Roundup called the Tableau Community Highlight. Find out how to get involved.

Nicholas Pillsbury, Staff Business Intelligence Engineer at Webflow
Seattle, Washington
Nicholas Pillsbury is a Staff Business Intelligence Engineer at Webflow. His journey into the data world began when his strong proficiency in Excel led him to volunteer with a Business Intelligence (BI) team at work. As the data grew too complex for spreadsheets to handle, Nicholas pivoted to Tableau, teaching himself by deconstructing the work of others and finding inspiration from the DataFam.
Outside of work, Nicholas is an active member of the Tableau community, driven by the belief that no request for feedback should go unanswered. He participates in community challenges like #GameNightViz, #MakeOverMonday, IronViz, and more. On Tableau Public, Nicolas gets inspiration from other vizzes but also from research papers where he can see alternative ways to visualize the same data. Nicholas views data as inherently fun and strives to break down the silos that often isolate data experts. Currently, he is channelled into the IronViz season, using the breadth of high quality submissions as fuel to revisit his older projects and upskill them.
Connect with Nicholas on Linkedin and Tableau Public.
DataFam Content
- Christina Gorga: A 2025 Retrospective
- Fiona Crocker, Sarah Burnett, Kevin Wee, Heather Cox, Ann Pregler, Kimly Scott: D28 Tableau IronViz Secrets: Storytelling, Colour Theory and Cultural Connections (Part 1)
- Fi Crocker & Sarah Burnett: D29 Tableau IronViz Secrets: Storytelling, Colour Theory and Cultural Connections (Part 2)
- Kyle Massey: Unified Access Tokens for Tableau Cloud
- Lisa Trescott: Emerald City Insights
- Matt Huff: Image magic in Tableau with maps
- Nathan Settembrini: From Slide Rules to AI Agents | 50 years in 60 minutes with Peter Coffee (Ep 010)
- Tarun Gupta: Tableau Next Tips #2 : Key Considerations, Guidelines, and Limits
- Tristan Guillevin, Jessica Bautista: Trusted Viz Extensions are now live on Tableau Public and Desktop
- Steve Wood: Tableau and Databricks Part 1 – Getting Started
- Deepak Holla:
- Tableau Basic Terminology: What are Cards?
- Tableau Prep Builder Topic: How Does Tableau Prep Store Your Data? The Truth Behind the Scenes
- Tableau Basic Terminology: What are Legends?
- Stop Trusting Dirty Data: 10 Tableau Prep Features Every Tableau Developer Should Know
- Important Logical Functions in Tableau Desktop -For conditional logic, data validation, and creating custom categorizations or calculations based on specific criteria
Team Tableau Content
- The CFP for TC26 in-person sessions is now open, and closes on Friday, January 16, 2026 at 5:00 p.m. PT
- Watch DataFam Europe 2025 Sessions on Salesforce+
- Join the Tableau Hackathon, enter by Jan 12, 2026
- Blog: Monitor Tableau Cloud Deployments of Any Size with the Platform Data API
- Blog: Explore the 2026 Iron Viz Entries
Visualizations
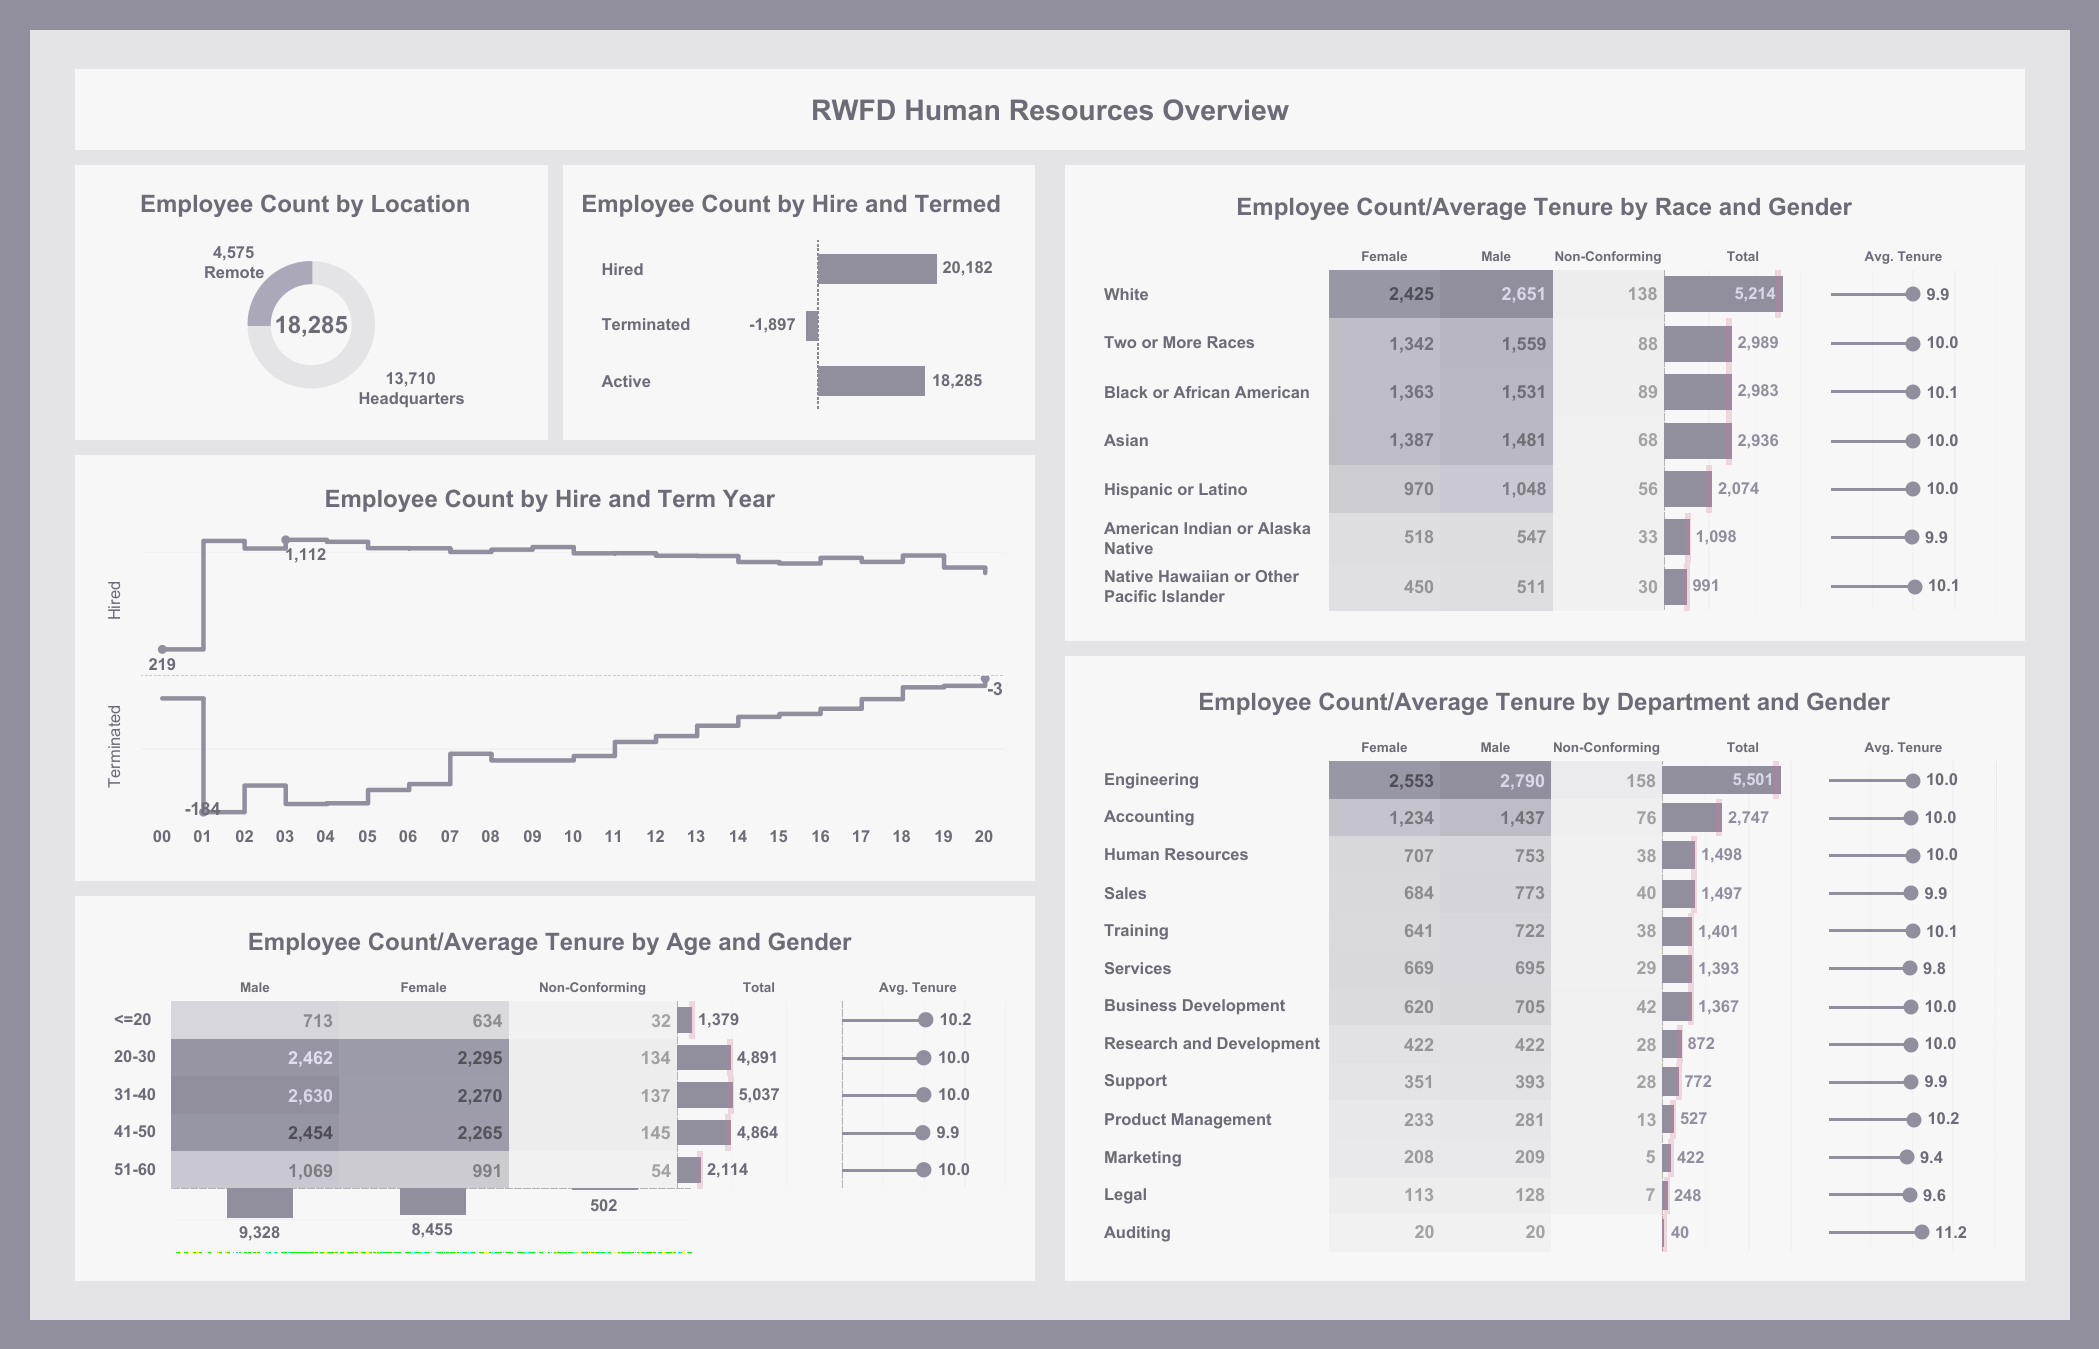
Jennifer Dawes: RWFD Human Resources Overview
See the latest Viz of the Day, trending vizzes, featured authors, and more on Tableau Public.
Check out some inspirational vizzes created by the community:
- Anna Clara Gatti: Merry Christmas #DataFam
- Andrea Mendoza: Top 1,000 Books Swapped
- Nobu Kimura: MoM2025 W48 Which AI Models Hallucinate the Most
- Iris Sun: 30 Day Map Challenge Day 1: Points
- Johan de Groot: Top 2000 of 2025 in 3D perspective
- Lauren Cristaldi: Tableau Advent Calendar | Dashboard Audit & Scoring with AI
- Takeshi Hizukuri: MoM2025W37: AI Job Trend
Community Projects
Back 2 Viz Basics
A bi-weekly project helping those who are newer in the community and just starting out with Tableau. Not limited just to newbies!
Web: Back 2 Viz Basics
X: #B2VB
Workout Wednesday
Build your skills with a weekly challenge to re-create an interactive data visualization.
Web: Workout Wednesday
X: #WOW2022
Preppin' Data
A weekly challenge to help you learn to prepare data and use Tableau Prep.
Web: Preppin’ Data
X: #PreppinData
Makeover Monday
Create business dashboards using provided data sets for various industries and departments.
Web: Makeover Monday
X: #MakeoverMonday
Data ChangeMakers
Volunteer to design data visualizations that help nonprofits harness the power of data for social change.
Web: Data ChangeMakers
Visual Climate
Collaborate and share climate data.
Web: Visual Climate
X: #VisualClimate
DataFam Con
A monthly challenge covering pop culture and fandoms.
Web: DataFam Con
X: #DataFamCon
EduVizzers
A monthly project connecting real education data with real people.
Web: Eduvizzers
Games Night Viz
A monthly project focusing on using data from your favorite games.
Web: Games Nights Viz
X: #GamesNightViz
Iron Quest
Practice data sourcing, preparation, and visualization skills in a themed monthly challenge.
Web: Iron Quest
X: #IronQuest
Storytelling with Data
Practice data visualization and storytelling skills by participating in monthly challenges and exercises.
Web: Storytelling with Data
X: #SWDChallenge
Project Health Viz
Uncover new stories by visualizing healthcare data sets provided each month.
Web: Project Health Viz
X: #ProjectHealthViz
Diversity in Data
An initiative centered around diversity, equity & awareness by visualizing provided datasets each month.
Web: Diversity in Data
X: #DiversityinData
Sports Viz Sunday
Create and share data visualizations using rich, sports-themed data sets in a monthly challenge.
Web: Sports Viz Sunday
X: #SportsVizSunday
Real World Fake Data
Create business dashboards using provided data sets for various industries and departments.
Web: Real World Fake Data
X: #RWFD
Data Plus Music
A monthly project visualizing the data behind the music we love!
Web: Data Plus Music
X: #DataPlusMusic
BizViz52
A weekly project centered around designing business dashboards.
Web: BizViz52
X: #BizViz52
関連ストーリー

DataFam Roundup June 2026

DataFam Roundup May 2026

Iron Viz 2026: Read Between the Data
 2026/05/28