Dev squad wows Tableau crowd with heatmaps, vizzes in tooltips, and cows!


One of our favorite parts of Tableau Conference is hearing from our developers on stage and seeing them show off all of their greatest innovations. And this year’s Devs on Stage did not disappoint! Shahaf Nuriel, Kent Marten, Marcelo Guerra Hahn, Neelesh Kamkolkar, and Rachel Boy shared features and live demos from Tableau 10.4 (our latest release), plus exciting features now available with the Tableau 10.5 beta. They also showed off some upcoming capabilities we’re working on for 2018. Here’s a recap of some of the best highlights.
More analytical power
We’ve been hearing about all of the great things you’re doing since we released the spatial file connector in Tableau 10.2, but we also know many spatial analytics scenarios are not limited to local data. We are excited to unlock these scenarios with spatial database connectivity, coming to Tableau in 2018! Kent Marten, Product Manager for Maps and Spatial, walked us through how you can simply connect to your spatial database and start building a viz.
And there’s more! When analyzing spatial data you often want to analyze points within a geographic area. With spatial joins, coming next year, we’re making it easy, even if the only common element between two data sets is location.

When you make a spatial join, you’ll be able to instantly see marks within a polygon. With spatial joins, you can analyze customer information inside your trade areas, group shipping vessels by nautical boundary, and even count birds in a watershed or habitat range.
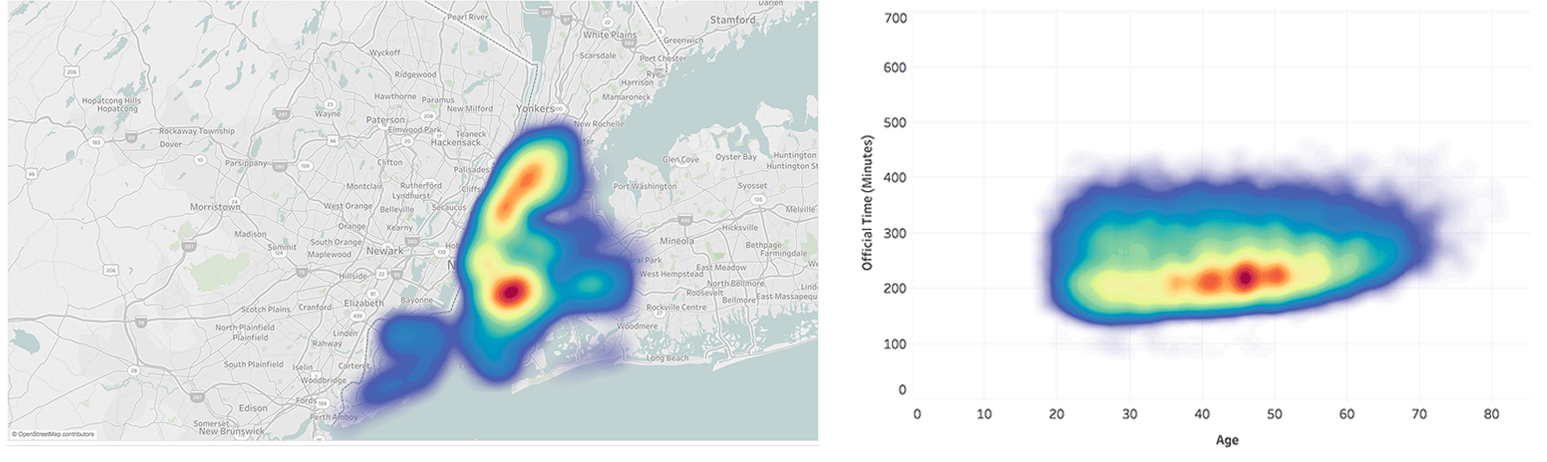
And things are getting even hotter with our maps! Kent Marten also showcased how it’s been difficult to understand concentrations on a map, so we’re excited to bring an entirely new viz type to Tableau next year—the heat map! With heat maps, it’s easy to answer spatial distribution questions by using color to understand density. And density doesn’t only apply to maps; the density mark type works for scatterplot as well! (Mic drop, cheers from crowd!)
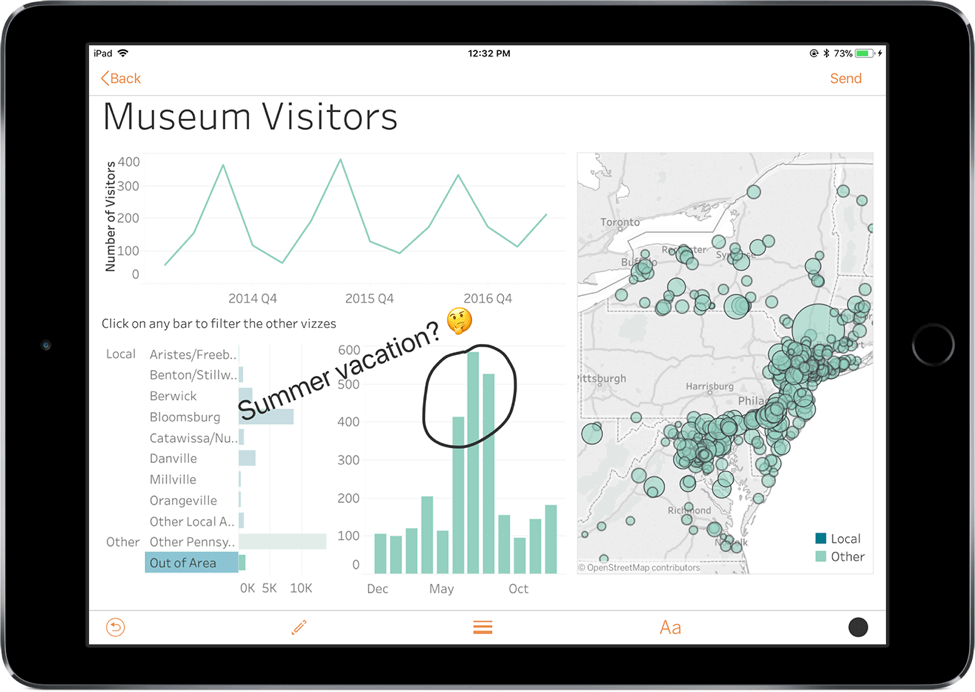
Then there’s that moment when Software Engineer Shahaf Nuriel made everyone in the audience “ooh” and “ahh” because of her vizzing powers. Yep, Tableau has added another viz-tastic update that we know you’ve been asking us for! Now you can maximize your dashboard real estate and engage with your data at an even deeper level with Viz in Tooltip, in beta with Tableau 10.5. All you have to do is hover over a mark to display details-on-demand, all while staying in context of the original view.

And to make it easier to create beautiful dashboards, we’re bringing a new grid view, and the ability to finetune dashboard object placement with a keyboard. Coming to Tableau in 2018, these dashboarding tools will allow you to design beautiful and precise dashboards even faster. Software Engineer Shahaf Nuriel entertained this highly requested feature with a ruler drop, and a prominent “Thank You!” could be heard from the crowd.

Easily deploy and change your Tableau Server to match your organization’s needs
Did you know Uruguay is number one in cows per capita in the world? Neither did we. But we digress. Engineering Manager Marcelo Guerra Hahn riveted the crowd by highlighting how we are making it easier for organizations to rapidly deploy and manage Tableau at scale. Central to this, we are excited to show off a powerful admin experience that you can access anywhere.

We’re excited to share the Tableau Server Manager coming in 2018! It’s a new way to remotely manage your server from the browser. With Tableau Server Manager, you can make live hot topology changes—no restart needed. And you can also automate your workflow through the accompanying command line interface. Now it’s easier than ever to quickly react to the changing needs of your organization and avoid downtime.

We’re also making it easier to work with different versions of Tableau deployed in your organization by making it possible to save your workbooks in an older version with improved workbook version compatibility. So there is no need to stress if you or someone you know aren’t using the same version of Tableau Desktop.
Helping you do governance right
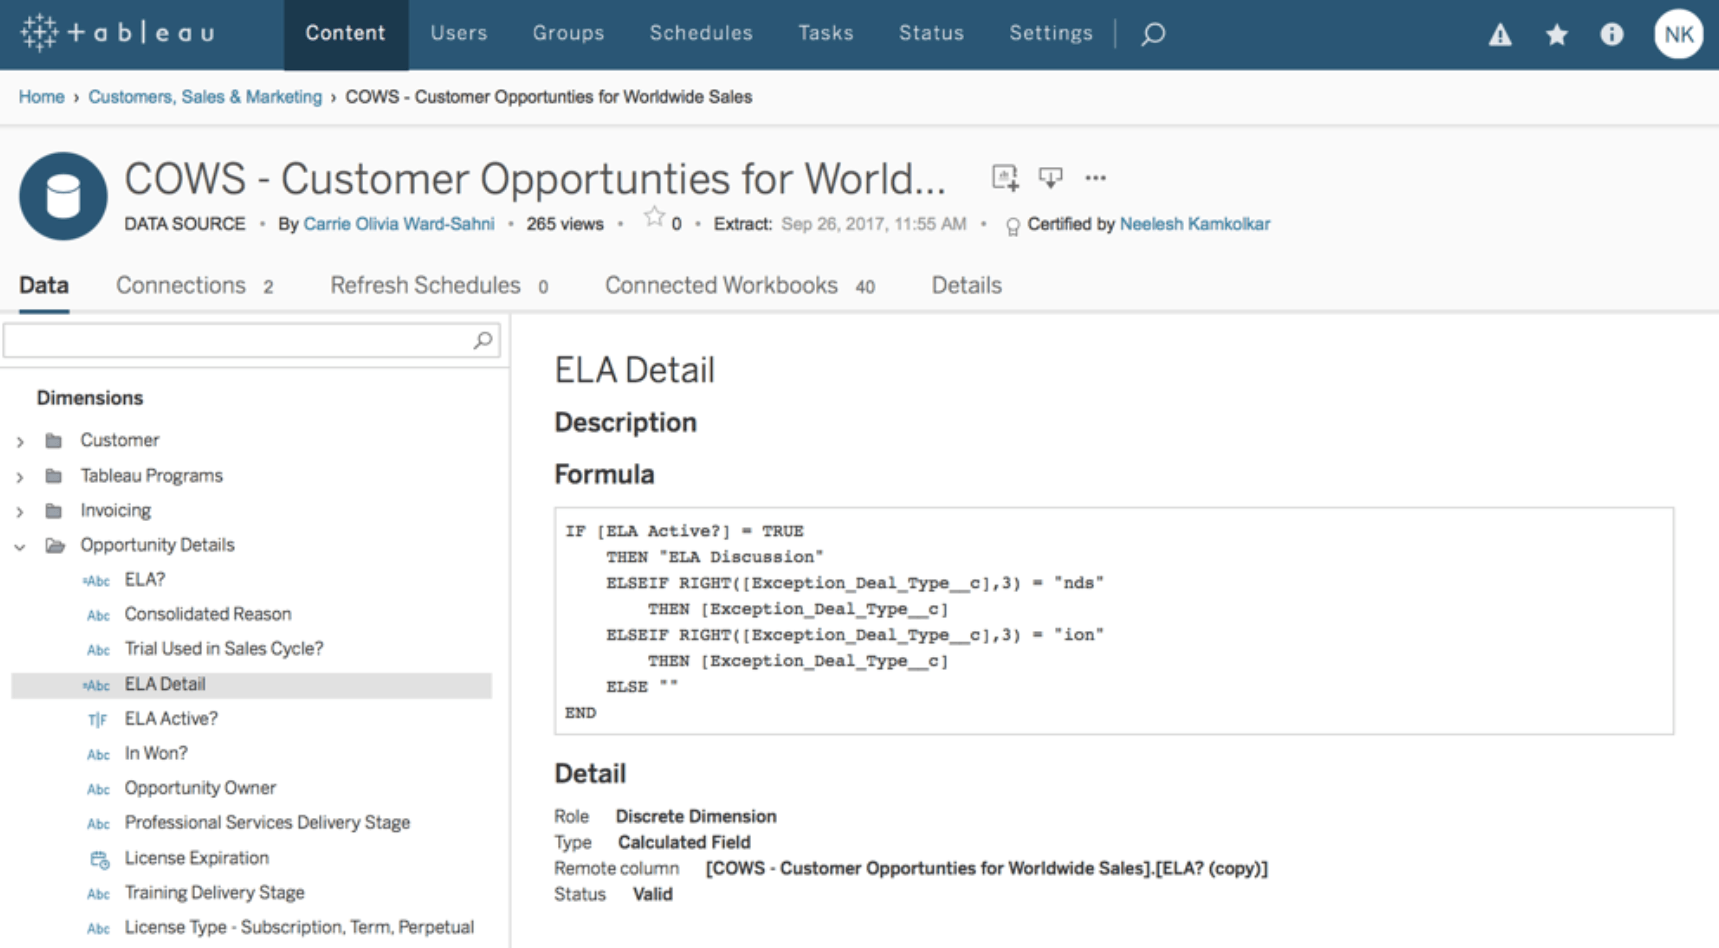
Neelesh Kamkolkar, a Data Product Manager, gave the audience a great reason to rejoice when he introduced data source certifications, now available in Tableau 10.4! Easily mark a data source as certified, so everyone knows they are connecting to the right data. These data sources get preference in the UI, search, and recommendations.
But it doesn’t stop with a certification— we’re working to make it possible to drill into the data itself. With lineage, coming in 2018, you can see what data sources are used directly from your dashboard.
With our new data source page, coming next year, you can drill down even deeper: You can see the exact calculations used, how fresh the data is, and other workbooks that leverage the data source.
More cool stuff you'll love
With every release, we’re bringing new functionality that lets you do more with Tableau, from easier content management, to new ways to collaborate.
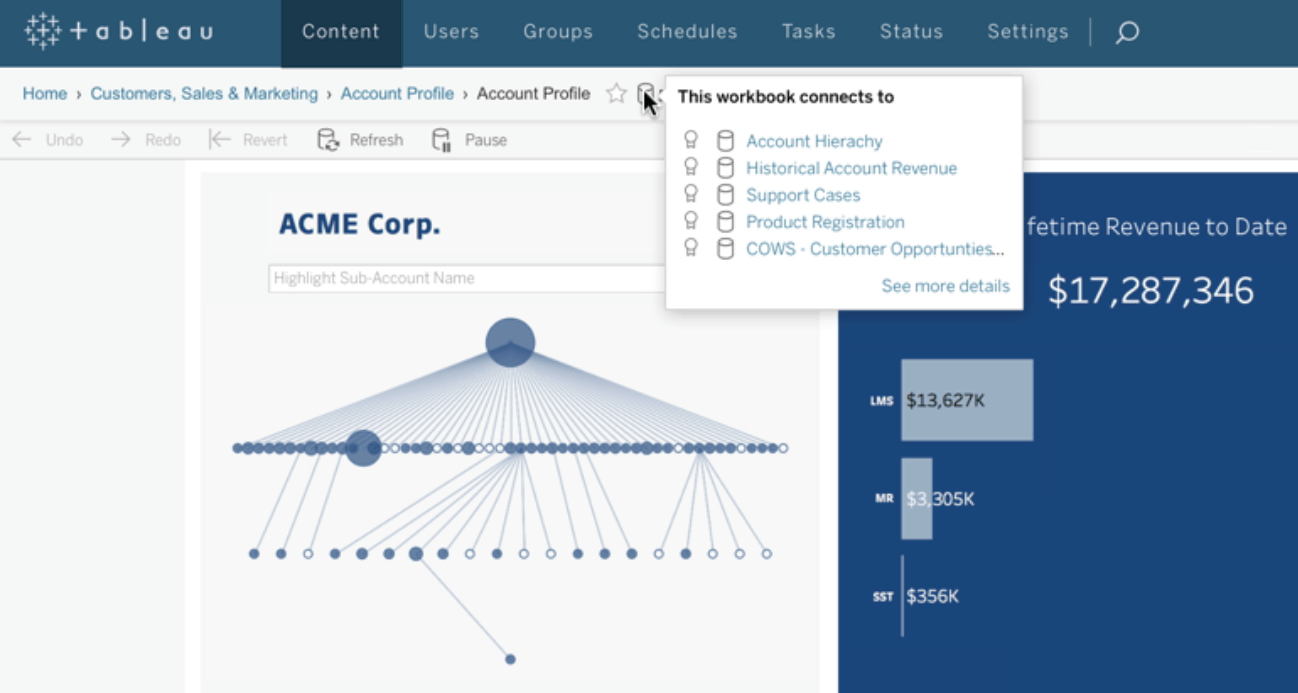
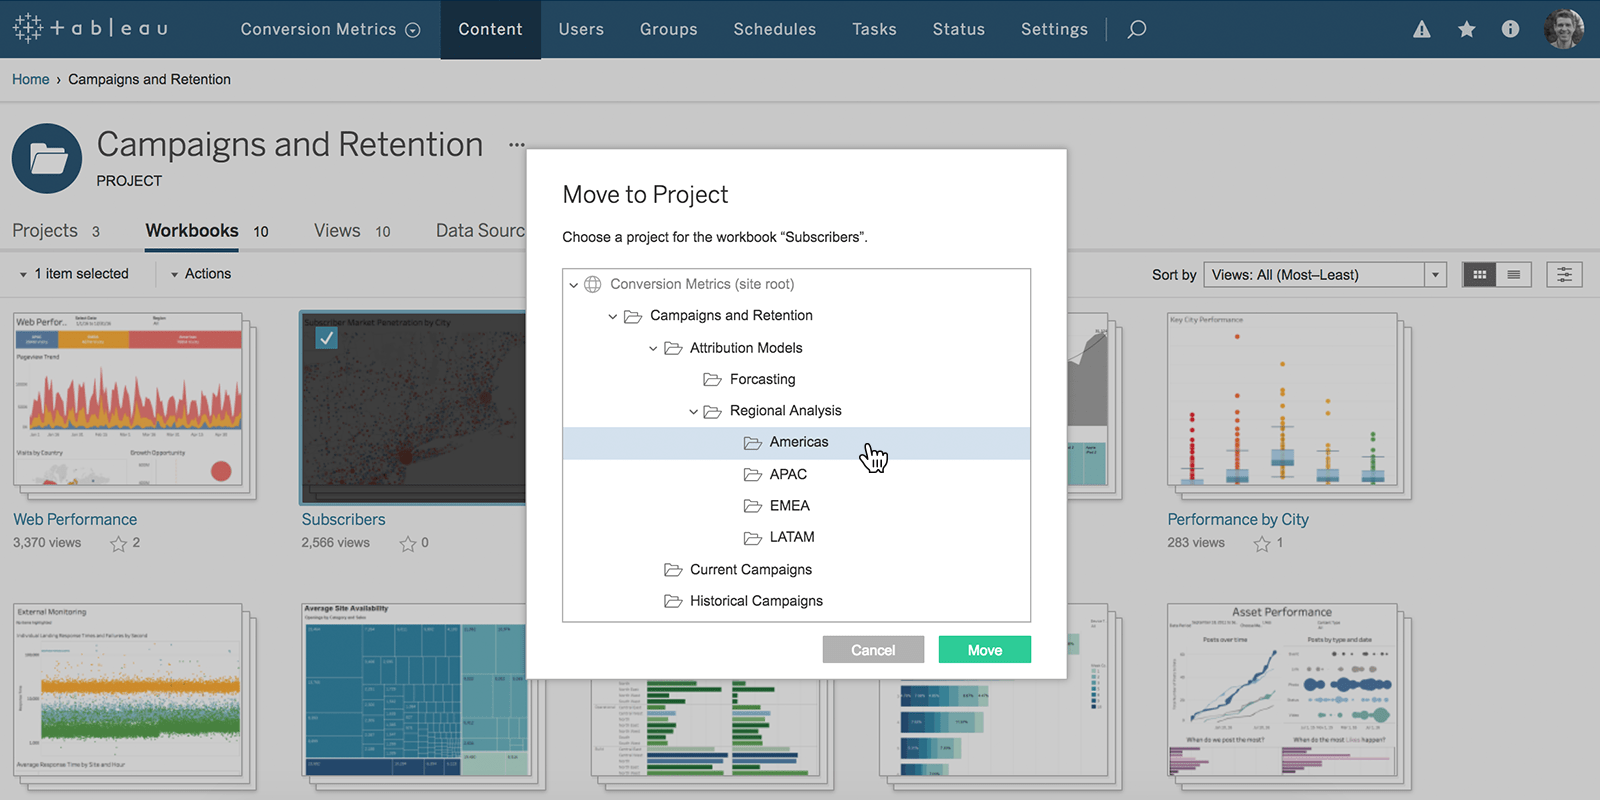
Rachel Boy, Software Engineer at Tableau, took the stage to chat about these great new collaboration tools. She showcased how we’re making it easier for you to organize your content in the way that makes sense to you. Currently, in beta with Tableau 10.5, you can now nest projects within projects, and customize permissions at each level, or choose to use a top-down permissioning structure.
But what if you don’t have any content? Building workbooks from scratch is hard when you have data sources with complicated fixed schemas, like Google Analytics. With prebuilt templates for popular web applications -- like Quickbooks Online, Eloqua and Salesforce -- a complete dashboard with your data is just a click away, all in the browser. With templates coming in 2018, you can start finding insights faster via a dashboard created with your data and visual best practices in mind.

And since it’s still your dashboard, and not a fixed template, you can add more data, tweak marks, or add entirely new views.
We’re also making it easier to collaborate while you are away from your desk. Coming to Tableau Mobile in 10.5, you can now annotate and share viz snapshots, right from the app. You’ll be able to draw and add text on top of a viz snapshot and share it through email, text, Hipchat, or Slack. Even cooler, the receiver of the viz snapshot will still have the option of interacting with the viz!
When you ask, we listen
This is a small preview of all the incredible features we’re building. Your feedback truly does help us guide our work. In fact, there are many new features already in the works that have come directly from your suggestions on our Ideas Forum.
Keep your ideas coming! Let us know what’s working, what needs work, and what you’d like to see in future releases of Tableau. We’re excited to see the impact you have with our product and your data.
Note: Many of the capabilities and products discussed in this blog post are not currently available and may not be ready on time or at all. We advise customers to make their purchase decisions based upon features currently available and upgrade to the latest version of Tableau to enjoy the latest capabilities.
Storie correlate

Extend Access to Embedded Tableau Content with On-Demand Access
 22 Luglio, 2026

The Tableau+ Bundle with Premium AI, Enterprise Capabilities, and Premier Success
 24 Giugno, 2026

What is Tableau Prep?
 30 Aprile, 2026