Tableau 8.1 and R


There are many reasons for this:
- The cost: While commercial distributions exist, open-source R is free.
- The rich features: R has an estimated user community of 2 million, which includes thousands of contributors from different domains expanding the language’s capabilities through new libraries.
- The quality: R libraries are enhanced by domain experts and field-tested by the large user base including other experts with real data sets in real analysis scenarios.
- The learning resources: Thanks to the active user community, plenty of tutorials and sample code are readily available.
When we were working on building a bridge between Tableau and R, we wanted to enable three core scenarios and types of users. Specifically, we wanted to:
- Give Tableau users access to a rich, ever-expanding collection of statistical analysis and data mining libraries to help them gain deeper insights from their data.
- Bring Tableau’s fluid data exploration experience and broad connectivity options to R users.
- Enable consumers of Tableau worksheets and dashboards take advantage of R, simply by interacting with the visualization or widgets without the need to have any knowledge of the language.
With these goals in mind, Tableau 8.1 offers four new functions in the calculated field list: SCRIPT_REAL, SCRIPT_INT, SCRIPT_STR and SCRIPT_BOOL for handling results of different data types from R. (To skip directly to information about setting up R integration, jump to the end of this post)
Analyze your data source of choice at the speed of thought
Some of the most commonly asked questions on R discussion forums are about basic data shaping and management such as connecting to databases or how to filter, group or aggregate data inside an R data frame. It is very easy to do these when you couple R with Tableau, allowing you to explore and try new things on a whim, moving fluidly from one view of your data to another. Tableau also has many connectors tailored specifically for each database and employs a number of optimizations that are not available if you were to connect to a database directly from R using a package like rodbc.
In the video above, all we have is a single calculated field for identifying outliers in our data:
IF SCRIPT_REAL("library(mvoutlier);sign2(cbind(.arg1))$wfinal01", AVG([Flow CFS])) == 0 THEN "Outlier" ELSE "OK" END
The rest is the same Tableau experience you know and love!
Meet your advanced analytics toolbox
R provides a wide variety of analysis techniques, including statistical tests, linear and nonlinear modeling, time-series analysis, classification and clustering.
I would like to start with an example that involves clustering since it is a common exploratory data analysis task used in many fields from marketing to social sciences and biology. Fisher’s Iris dataset is the classic example used in almost every data-mining textbook. It consists of petal and sepal dimensions of a mixed sample from 3 species of Irises.
To identify the natural clusters in this dataset we will be using a technique called “k-mean clustering." This could easily be done in a calculated field with a single line of R code.
SCRIPT_INT(‘kmeans(data.frame(.arg1,.arg2,.arg3,.arg4),3)$cluster;', SUM([Petal length]), SUM([Petal width]),SUM([Sepal length]),SUM([Sepal width]))
Here .argN corresponds to the measures/dimensions you are passing from Tableau to R. For example .arg3 passed the values of SUM([Sepal length)] to R. Note that since SCRIPT functions are table calculations, these are all passed as aggregates. If you have one or more aggregated measures or dimensions, you can also pass Tableau parameters to R.

Here you can find the Tableau workbook that contains a working example, as well as the actual species information for each data point to see how accurate our classification was.
As long as the SCRIPT function returns one result for each partition or the same number of records as in the partition, Tableau will have no problems aligning the results with your input data. However if you sent 10 rows to R but got 3 rows back, Tableau will need your help figuring out how those 3 rows need to be associated with the 10 input rows. You can find the answer to this question in the k-means clustering example workbook by looking at the ClusterCenters calculated field.
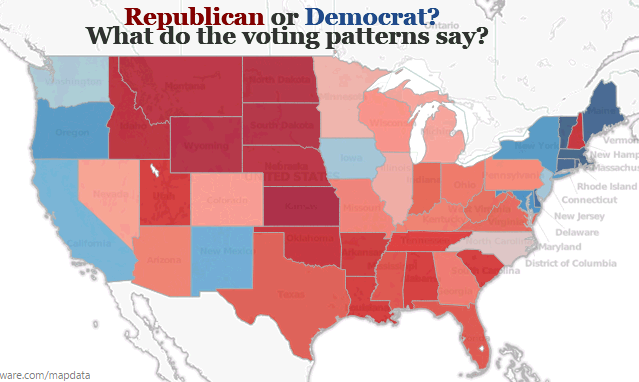
Another good use case for R and Tableau is to transform complex datasets into forms suitable for visual exploration. Take roll call data for example. The dataset contains votes (yay, nay, no vote) for each member of the 111th House, a total of 1602 columns and 445 rows. Because there will be a range of topics being voted on, for the analysis to yield meaningful results we cannot simply create one aggregate for state or representative; we need to do comparisons within each voting session. Given the number of columns and the fact that parties often don’t vote in blocks, we can’t do this visually by using a heat map or scatter plot. The example workbook here shows how to transform this data using R into something consumable in a scatter plot or a map (as shown below) using a method called multidimensional scaling.
Empower your audience
R is great, but programming in R is not for everyone. The learning curve is steep if you are not an experienced programmer. Even if you are, certain aspects of the language can take some getting used to. But as you saw in all our examples, once you create the calculated fields and set up your visualization, the result feels just like any other Tableau dashboard. So you can publish your workbook on Tableau Server and even viewers who have never heard of R or written a single line of code in their lives will be able to take advantage of R simply by interacting with your visualization.
Our last example shows how you can user Tableau parameters and R calculated fields to create a dashboard that allows your users to perform a simple "What-If?" analysis.

Setting up Tableau Desktop with R
Getting started with R on Tableau is easy (and you'll need to set up the connection before you can use any of the attached examples in this post, along with the 8.1 beta). Tableau communicates with R using a package called Rserve. If you do not already have R, you will want to install R and Rserve on computer running Tableau Desktop. You can get R from from http://cran.us.r-project.org/. You can install and initiate Rserve from R command line by entering:
install.packages("Rserve"); library(Rserve); Rserve()Alternatively, you can have Tableau run R scripts on a remote server running Rserve.
Next, you will want to configure your connection. You can do this using a new item in the Help menu: “Manage R connection…”.

R on Tableau Server
Configuring Rserve connection on Tableau Server is done through tabadmin. Once you provide the Rserve information, all the workbooks published on that particular Tableau Server will use that Rserve instance which could be the on the same machine as Tableau Server or on a separate machine. However for using Rserve in shared environments, we recommend installing RServe on Linux. This is because in Windows all communications with Rserve share a single session, meaning that users will be able to access R objects created by other users and can overwrite each other’s objects. On Linux, this is not an issue since each call to Rserve is treated independently.
I hope you enjoyed this quick start on Tableau and R. There are many other new features in 8.1. Stay tuned for more blog posts on what’s new and exciting.
Historias relacionadas

Extend Access to Embedded Tableau Content with On-Demand Access
 22 Julio, 2026

The Tableau+ Bundle with Premium AI, Enterprise Capabilities, and Premier Success
 24 Junio, 2026

What is Tableau Prep?
 30 Abril, 2026