Meet Iron Viz 2024 Finalist Jessica Moon


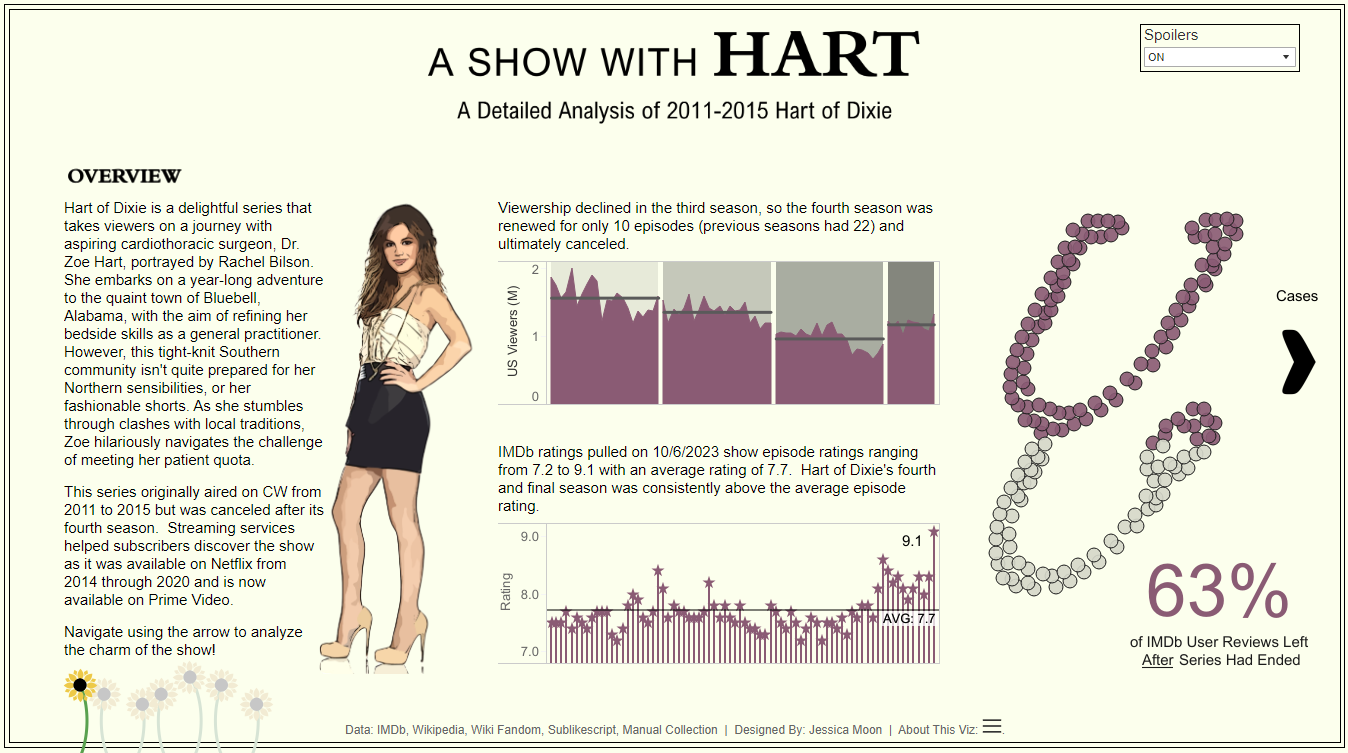
The viz that propelled Jessica Moon to the Iron Viz finals in San Diego reflects her love for Hart of Dixie, a TV comedy-drama series about the adventures of New York med school valedictorian Zoe Hart as she adjusts to life in the fictional small town of Bluebell, Alabama, after failing to secure a fellowship in The Big Apple because of her poor bedside manner. Jessica herself lives in Hunstville, Alabama, so Hart of Dixie is close to home.
“I was re-watching Hart of Dixie because it had been a while and I didn’t recall all the storylines,” Jessica explains. “When the Iron Viz theme dropped I thought, I love this show, so I figured I’d focus on it for my viz.” Several judges said the viz inspired them to watch all 77 episodes of the hit show, and praised Jessica’s “brilliant implementation” of data-driven line charts, advanced charts, glyphs and diagrams.
This is Jessica’s fifth time competing in Iron Viz. What keeps her coming back for more? “Iron Viz is a chance to prove to the world and myself what I'm capable of, and each time I learn something new about Tableau, data collection, and transformation.” Making it through to the finals at Tableau Conference makes the Iron Viz experience much more intense, she adds. “It's been a whirlwind! I alternate between being excited and terrified. I feel like the world's not slowing down enough for me to really get a full grasp on it.”
Like many other Tableau experts, Jessica did not set out to be a data analyst. She took a degree in nutrition and food science, and in 2013 went on to do an MBA with a specialization in contracts. Hunting for a job in contracts after giving birth to her first child, an opportunity arose to test data visualizations produced by a team using Tableau. By 2014, Jessica was a full-time Tableau viz tester. “As I got more comfortable with my teammates I began shadowing them, and there was a push for all team members to get their Tableau certification. That was probably the biggest push for me to learn the ins and outs of the tool.”
Although not from a technical background, she quickly found her feet in Tableau. “It was easy enough to figure out – very low code and drag-and-drop – so you could quickly make whatever you were thinking about creating. I liked the platform's format, which encourages learning at your own pace. I also enrolled in Kirill Eremanko’s ‘Tableau: A-Z’ course, focusing on the certification – advanced formulas, parameters, and bespoke visualizations.”
It almost goes without saying that the Tableau Community has had a profound impact on Jessica’s data journey. “The biggest thing about Tableau is the support. The Community roots for your success and your progression,” she says. “I've found some really great friends in the Data Fam and I enjoy the Community projects. They have a particular subject, maybe some guidelines, and often a data set with its own hashtag so you can find other people who are interested in the project.”
“I particularly enjoy B2VB–Back to Viz Basics–because they focus on just one element of visualization. They give you a data set and say ‘build your best table’, or ‘build a tree map’, or ‘use white space,’ so you're just thinking about one simple thing and trying to do your best with that guidance.”
Collecting the data for Hart of Dixie was a very manual, intensive process. “There are few things on fan pages and I was able to gather information on ratings and on the scripts, but the majority of the data in the viz was manually collected as I watched the episodes.”
When it comes to style, design and storytelling choices, the key decision was a desire to fit the whole viz on one screen, with no need to scroll. “With this viz, I really got into a new Tableau functionality called Dynamic Zone Visibility. You set up true/false statements that show or hide certain elements. When you're on page one, all the page one elements are visible. As you progress to page two, those elements disappear and the page two elements appear. So it's all effectively one dashboard.”
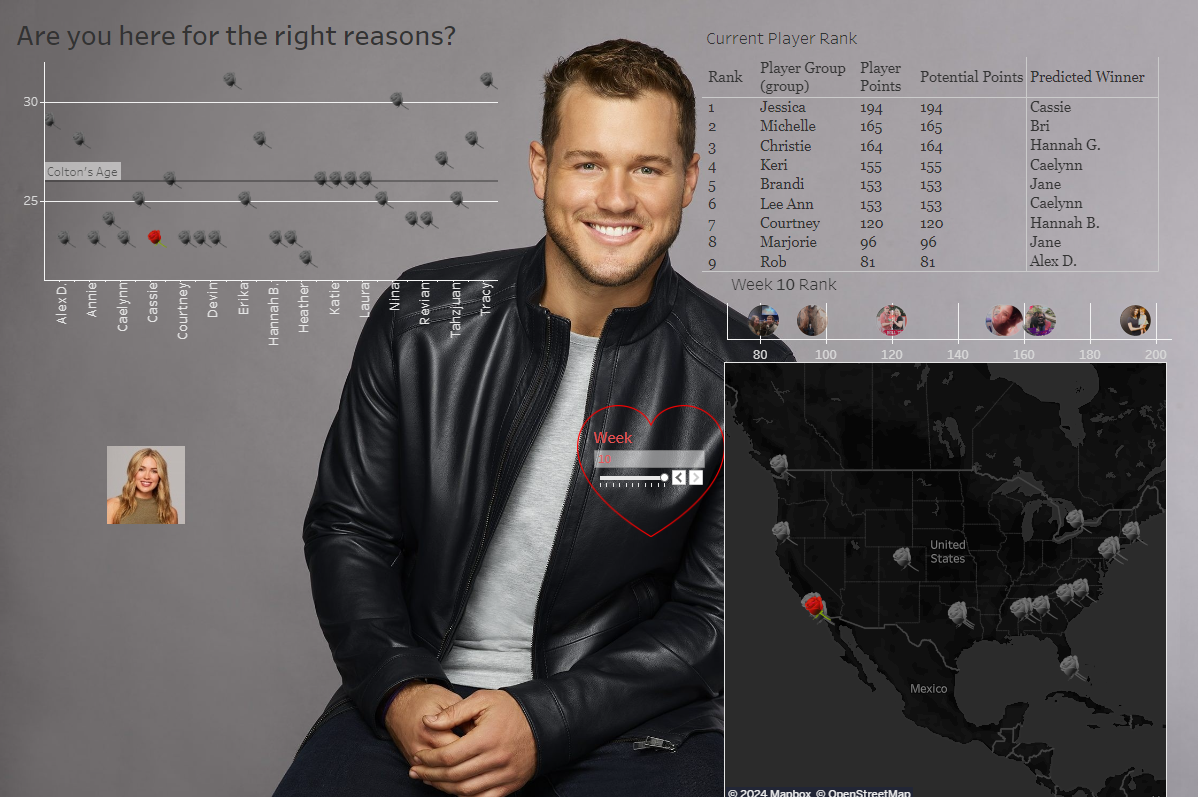
How does Hart of Dixie stack up against Jessica’s first Tableau viz? “My first Tableau Public viz was about another TV show, Colton's season on The Bachelor. I just went back and looked at it and I thought, you know what, this isn't bad, I still like it! I have certainly gotten better with the tool and with design in general, but my Bachelor vizzes are what helped me think outside the box and really helped me learn the tool.”
Like almost everyone who ever qualified for the Iron Viz finals, Jessica is apprehensive about going out on stage in front of thousands of people, but she’s focused on preparing a great viz for the big day.
“I'm still building it; still getting the initial design hammered out. I had a couple of things come up at work that had me a little distracted there for a couple of weeks, but now I'm buckling down! I visited Los Angeles in high school, so it's been a long time since I've even been to California, and I've never been to San Diego. I’m excited to be there!”
Historias relacionadas

Iron Viz 2026: Read Between the Data
 28 Mayo, 2026
Top 10 Qualifiers for Iron Viz 2026
