Improving tuberculosis detection in India with Operation ASHA and Tableau volunteers


When I’m asked about people living with tuberculosis (TB)—specifically how people live with the disease for such long stretches of time—I often tell them the story of Hamida. For her, having TB was not just a matter of a debilitatingly-painful cough, and constant fatigue that kept her from being able to do her daily routine, it is also a story of uncertainty and emotional strain. Beyond the physical symptoms, Hamida had the invisible labor of constantly hiding her sickness from her husband, from her children, and from her community.
TB is a bacterial disease transmitted via air droplets, most commonly through a human cough. One in three people on the planet are infected with the disease in their lifetime, and on average, three people die every minute from the disease. TB is entirely treatable at low costs and by community health workers (CHWs) who do not need to be highly-trained, medical professionals. All that is required of patients is taking a six- to eight-month course of medication and a regimen for ensuring that doses are not missed. It is the latter part where using data can save lives, having a transformative impact on the spread of the disease globally.

Auspicious beginnings for a joint data project
Operation ASHA (OpASHA) uses pioneering technology to provide communities in need with top-quality, end-to-end TB care. While our success to date has been unmatched, we know that the use of data analytics can further improve patient care.
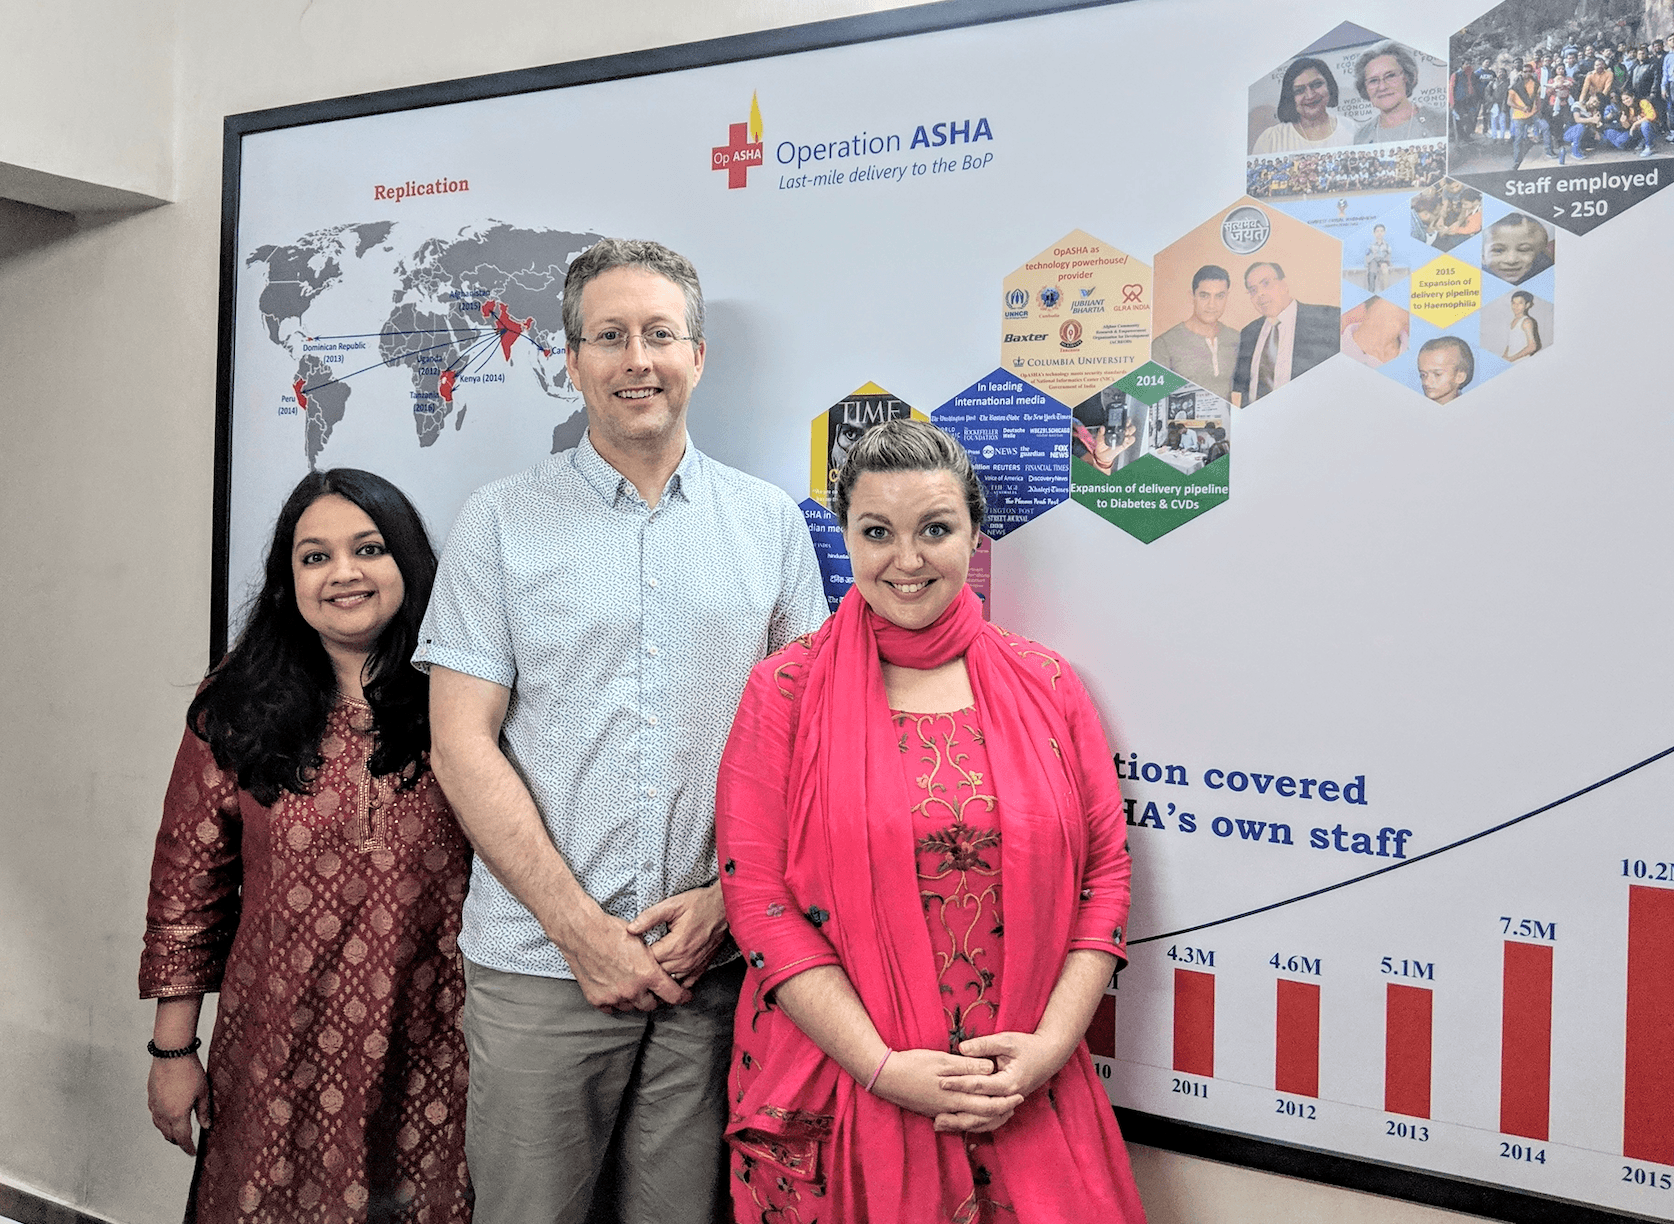
Fortunately, last year, the data gods smiled upon us when OpASHA teamed up with Tableau Foundation as the first-ever Mission Projects partner, a new program to embed Tableau Service Corps volunteers within NGOs for several weeks to prototype new solutions and build data skills across the NGO teams.
Before their arrival, we got to know the volunteers over weekly video calls. Tableau employees and Service Corps volunteers, Lauren Beck and Michael Becke, were both very excited about the project, as well as visiting India for the first time. This opportunity promised a rich experience for both the volunteers and the hosts in terms of not only improving TB detection, but also for exploring different cultures.
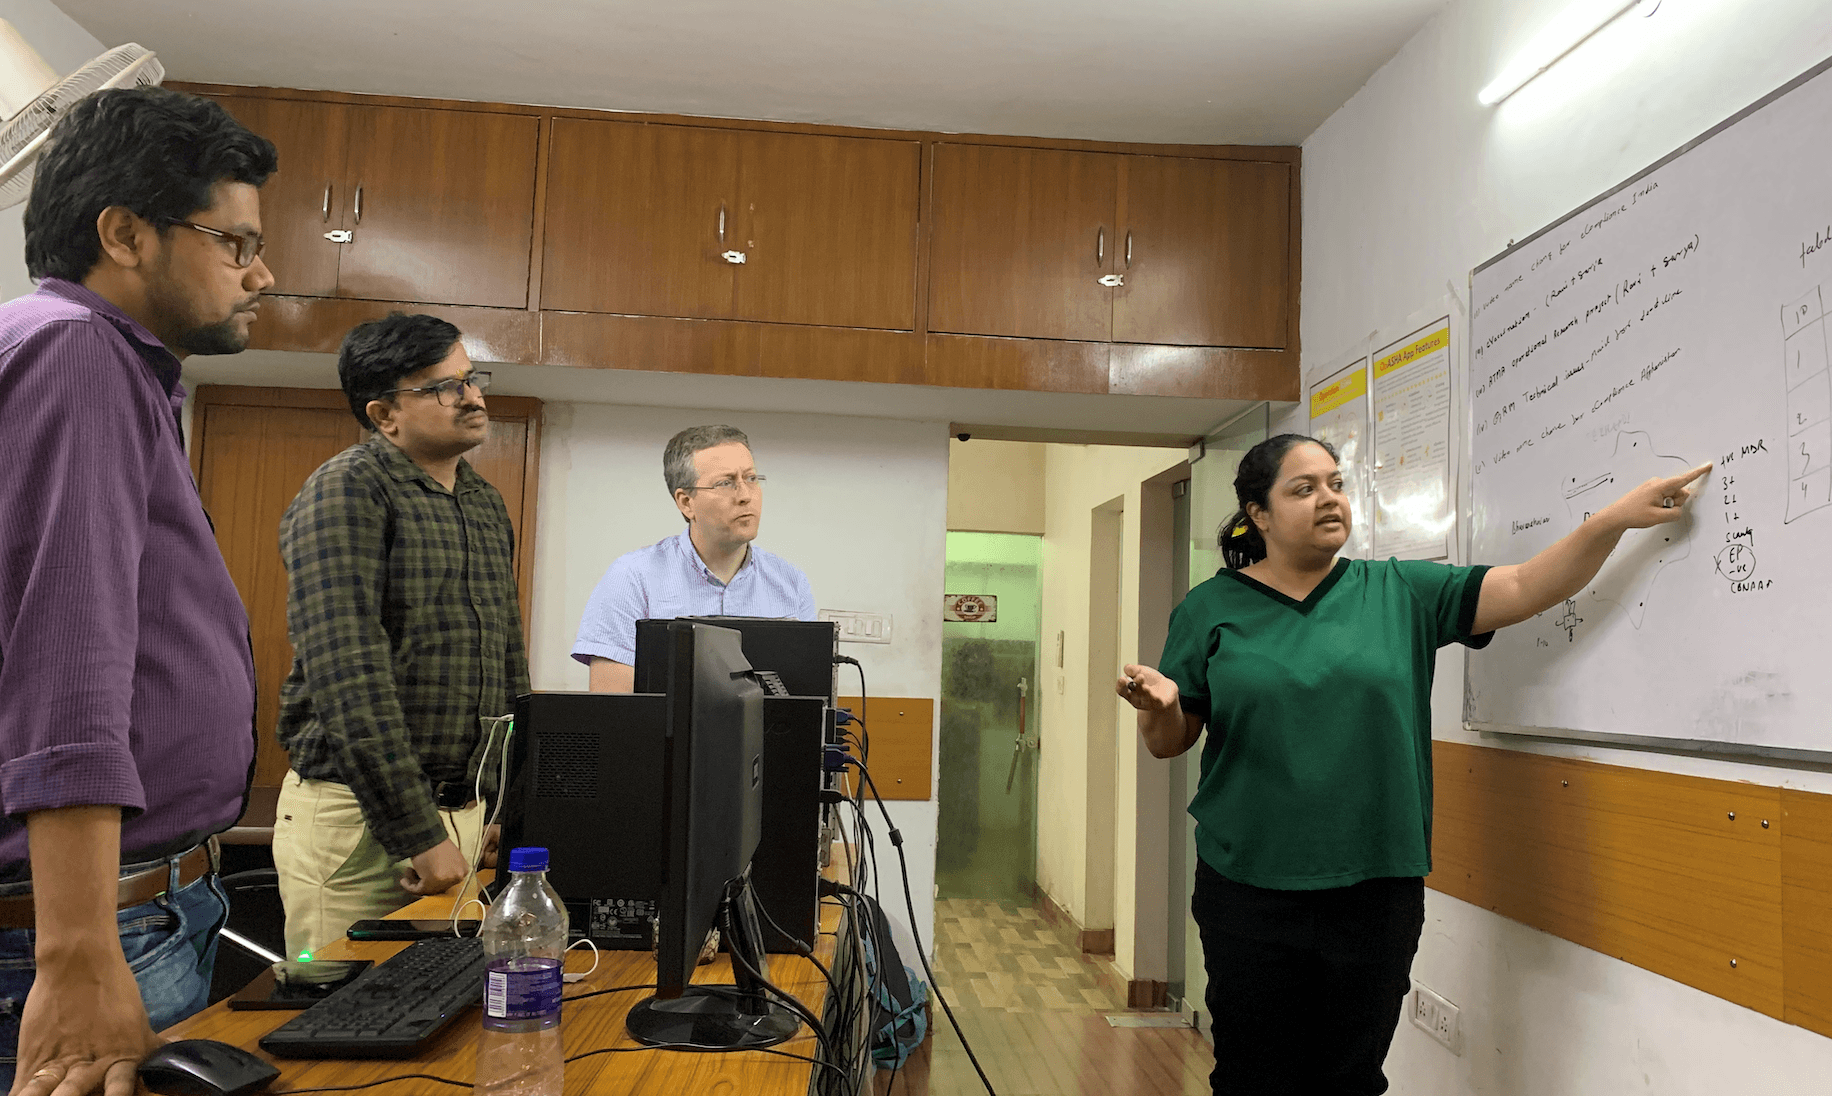
Once they arrived, I met Lauren and Michael and things kicked off quickly. What started with one meeting quickly became six. In just one day, the three of us managed to make an incredible amount of progress on the project—from brainstorming, to understanding and explaining the data, and setting a plan for the week. It was one of the most satisfying days of my entire career.
Using location data and patient records to design the solution
Together, what we came up with is a plan for helping OpASHA’s community health workers detect more patients by making it easier to identify individuals infected with tuberculosis. Since the disease is spread through air droplets, the chances of finding a TB patient would be higher in the houses adjacent to the houses of current TB patients. Those who carry the disease for a longer amount of time are also likely to have infected more people around them. We took all these factors into account while designing a strategy for the CHWs to look for and find TB patients. We incorporated the strategy in a mobile app that was developed for community health workers.
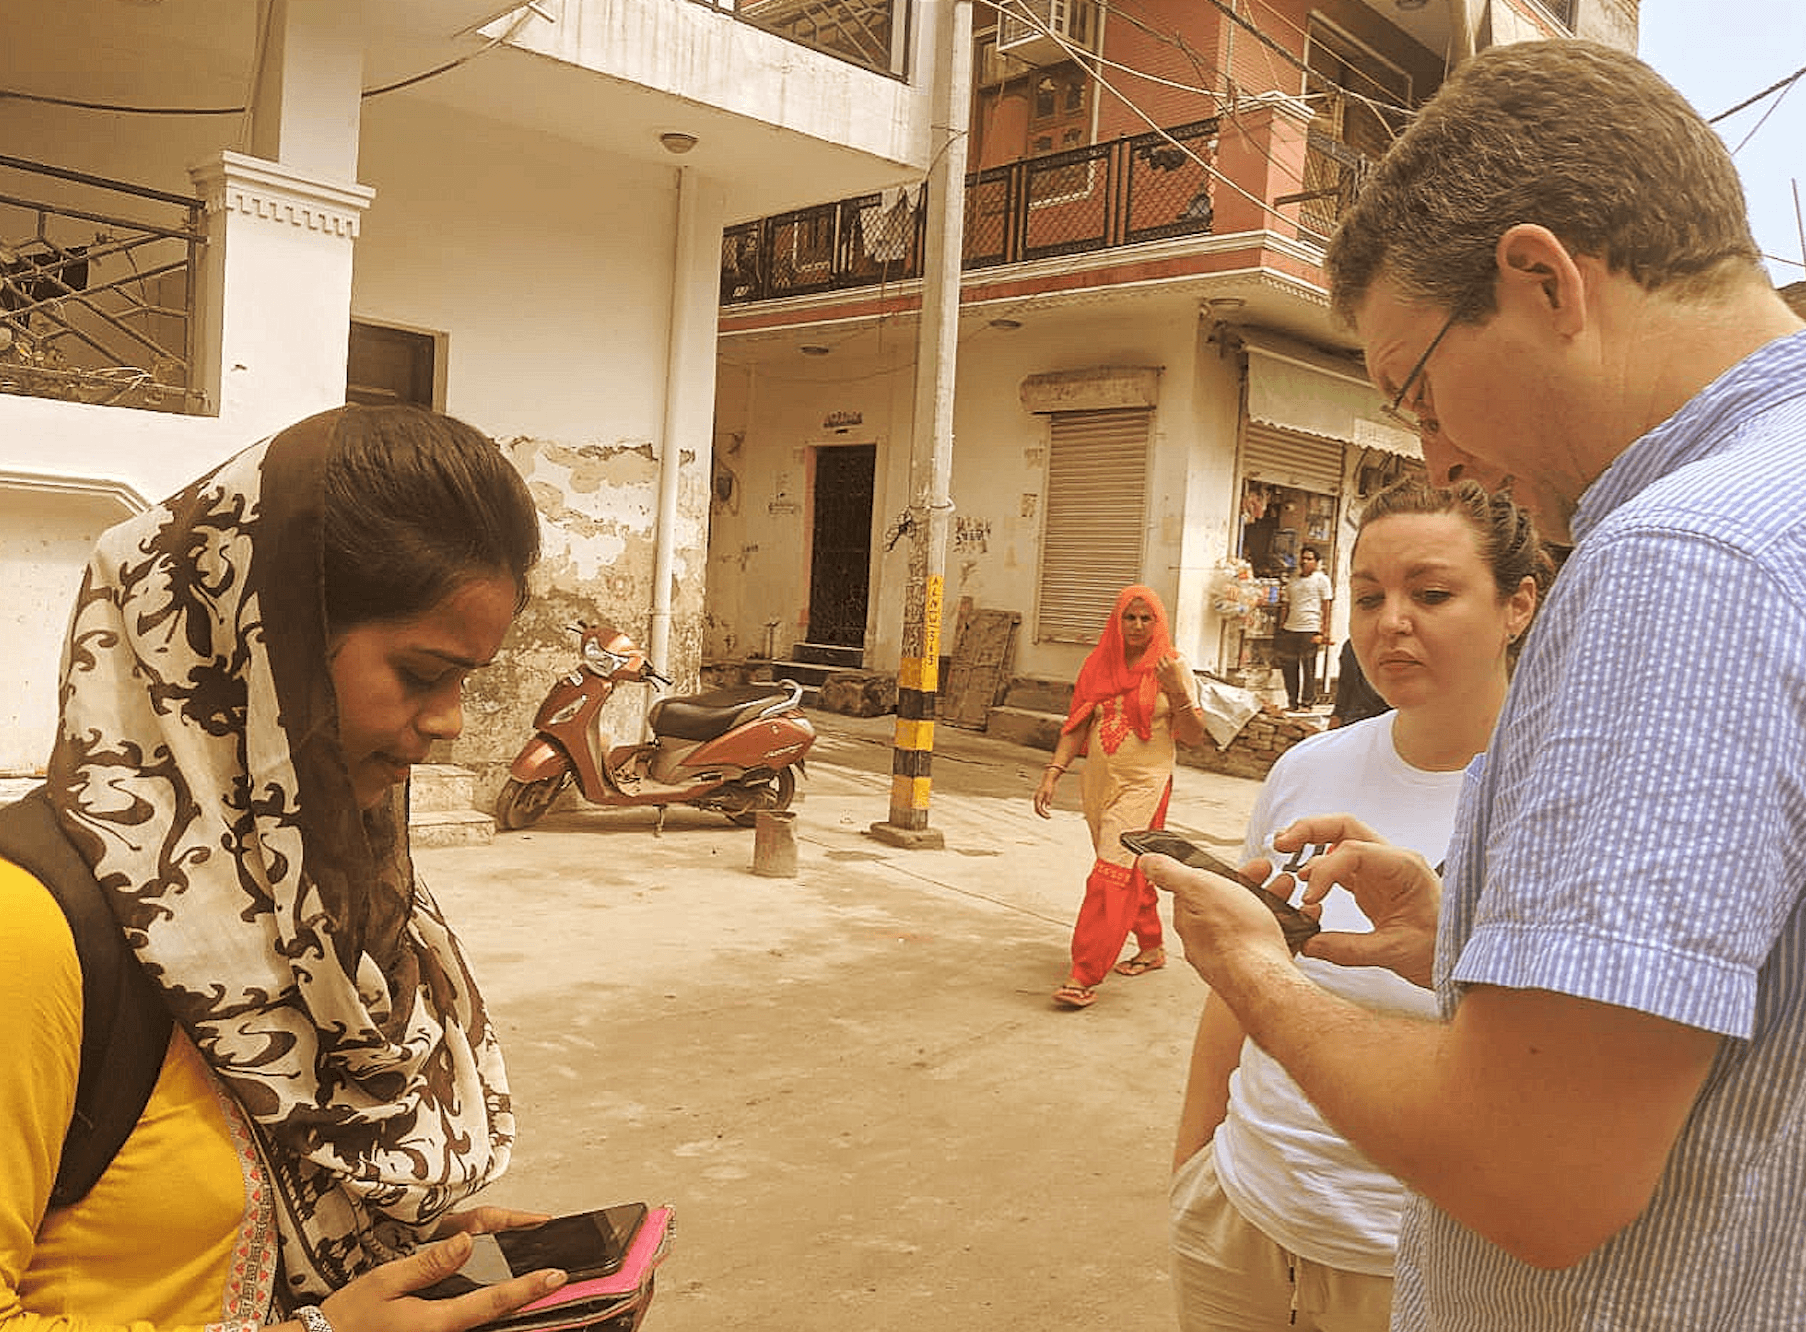
Our CHWs go door to door in urban areas—in this case, New Delhi—looking for people who show symptoms of TB, testing them, and initiating treatment as soon as possible. Since the area these CHWs canvas is huge and time is limited, it is extremely important that they have good information to focus their efforts.
Initially, we built a prototype of a solution that allowed the CHWs to use the GPS locations of homes of confirmed TB patients, linked to Google Maps, to test those in their immediate vicinity. Patient locations were made into hexbins for a density map so that CHWs could easily see the concentration of patients and avoid duplicating each other’s efforts. In the prototype, GPS locations were also color-coded by priority based on the stage or severity of the patient’s disease, varying in size based on the amount of time elapsed since the last CHW visit. The combination of size and color should significantly improve the community health worker’s ability to prioritize their efforts in the highest need areas.
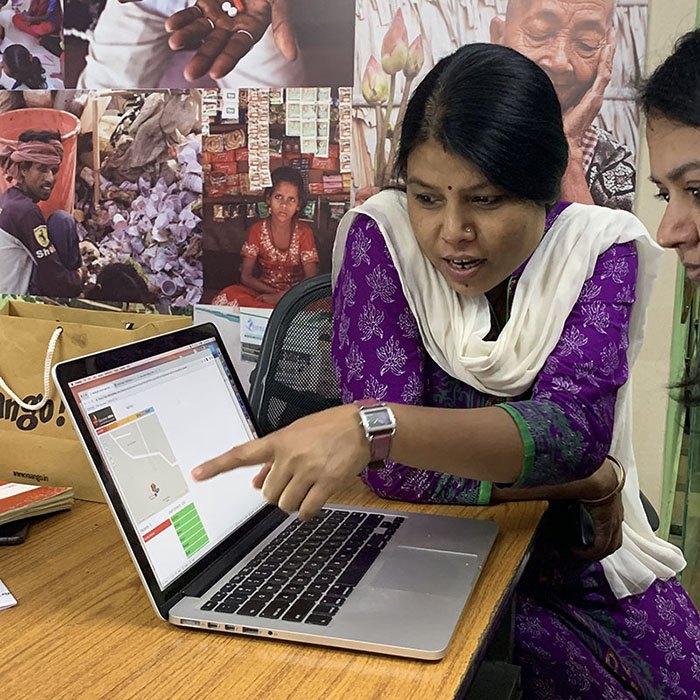
When the CHW clicks on the patient link on the map, it takes them to a page with step-by-step instructions on how to navigate to the patient’s house in the local language (Hindi). Any community health worker can now find cases in the highest priority locations first, before moving on to the locations with the next level of priority. Additionally, we added performance measurements to the app, so that CHWs can view their own performance over time, visible as graphs and a performance score. dashboard was also developed to help project managers monitor and evaluate each community health worker’s performance.
Putting the solution to the [field] test
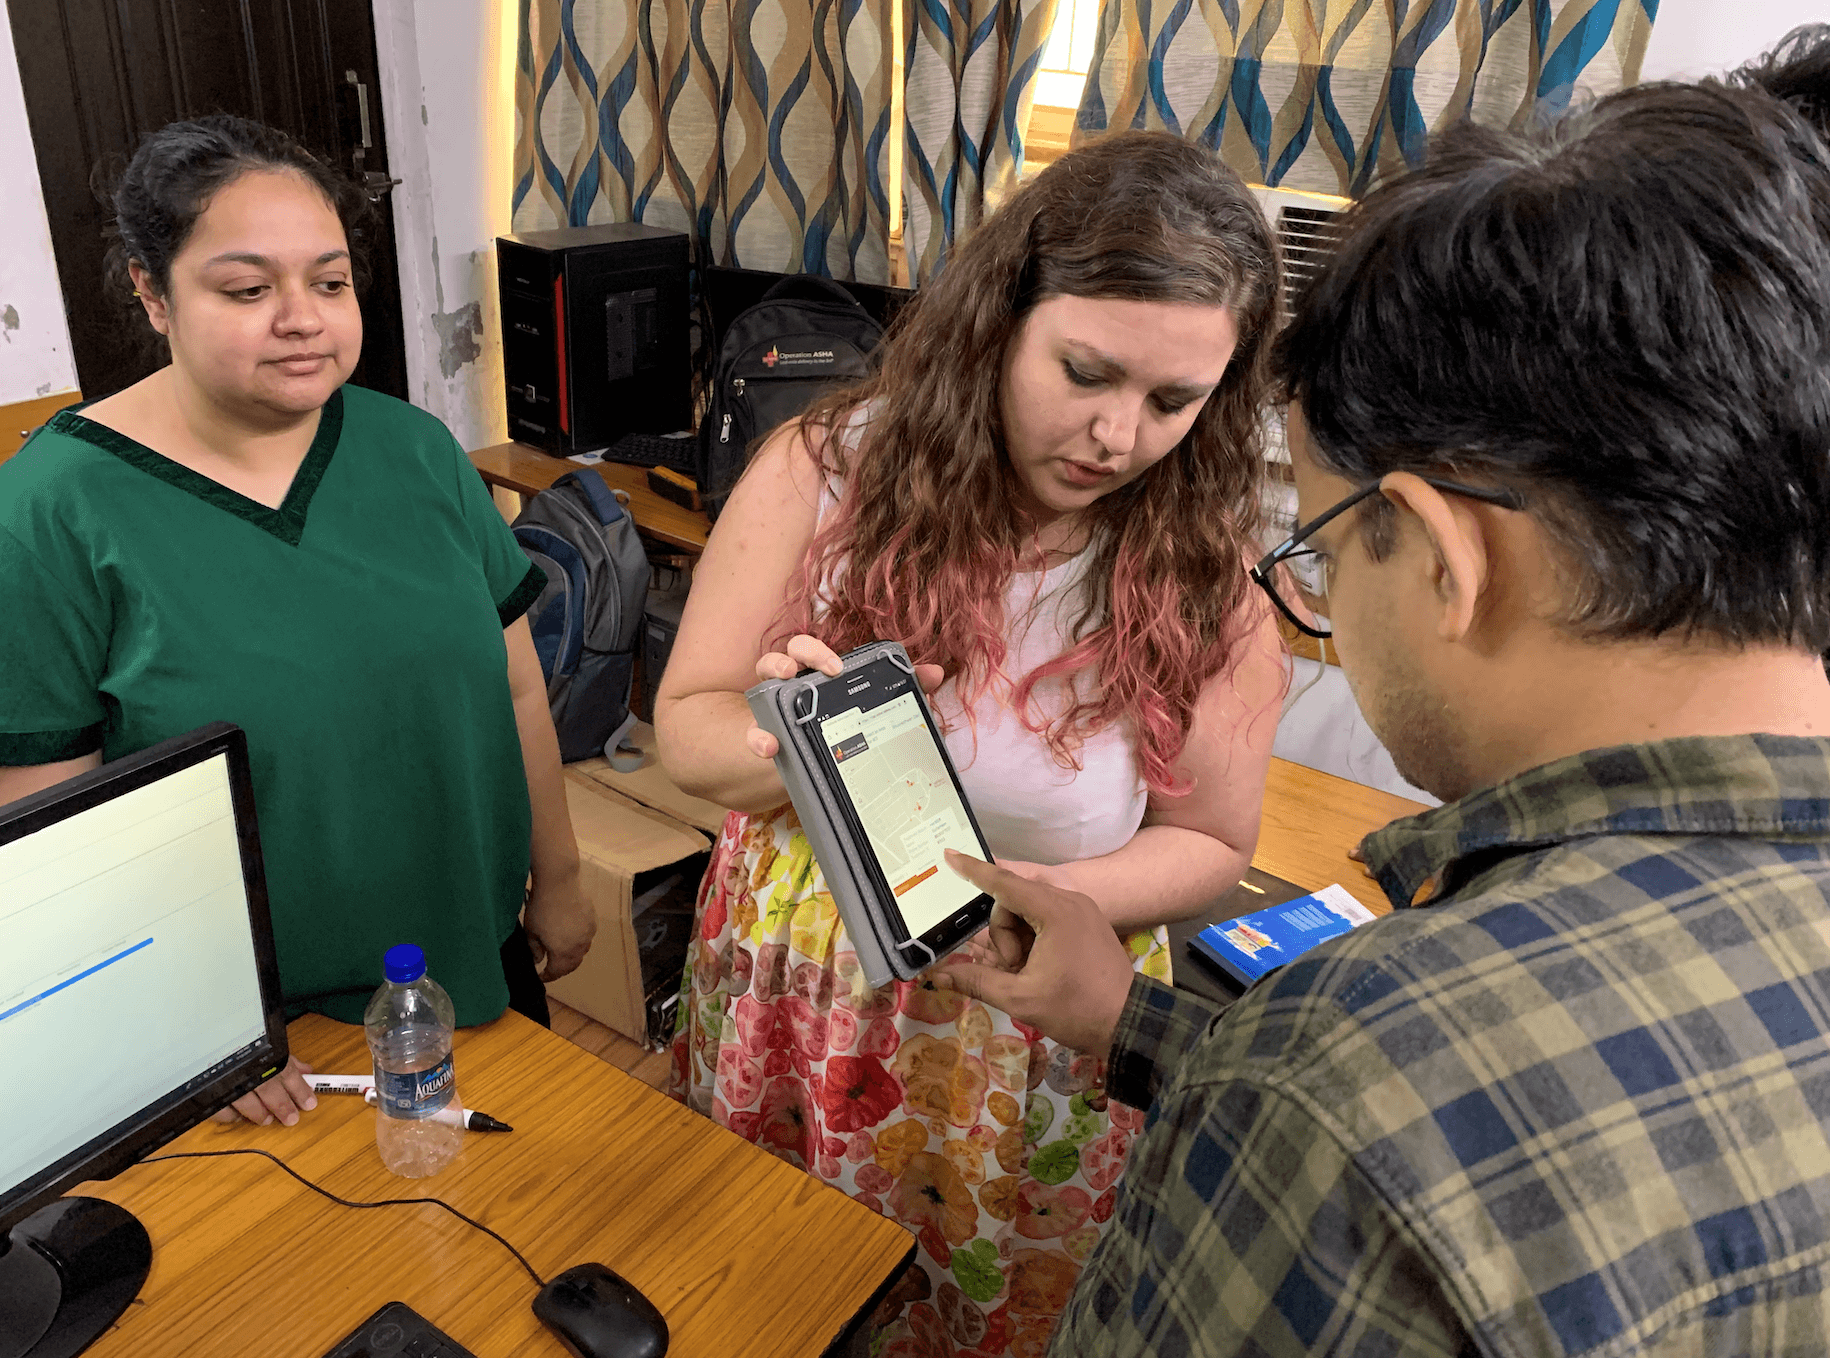
A preliminary field test of this tool was promising, but revealed that some of the collected GPS coordinates for patients’ homes were inaccurate. The code has been fixed and now the GPS coordinates are being captured accurately. As a short-term workaround solution, we also created a cross-tab list that prioritizes locations based on the same methodology.
We found that the CHWs who field-tested this prototype were very happy with it. While designing the app, OpASHA members, Lauren, and Michael were very careful to make the app as simple as possible, with minimal text so that even a semi-literate CHW who is not tech-savvy can easily use it. Since community health workers receive a cash incentive for each patient they accurately detect, the use of this app can lead to an increase in both TB detections and income for CHWs. In initial trials, CHWs were able to easily and confidently use both versions of the app, acknowledging it would make their work much easier. Over the next year, we plan to launch a field pilot in which this app shall be used by 10-15 CHWs in the Indian cities of Delhi and Gwalior.
Making OpASHA a more data-driven organization
In addition to contributing to this valuable project, the volunteers also found time to teach Tableau skills to the entire office staff while they were in India. Lauren and Michael encouraged OpASHA employees to ask questions about the data and taught them how to uncover valuable insights. We have already started using Tableau visualizations in our quarterly meetings in order to compare performance among various teams and champion successful program managers (PMs) as models for others to learn from.
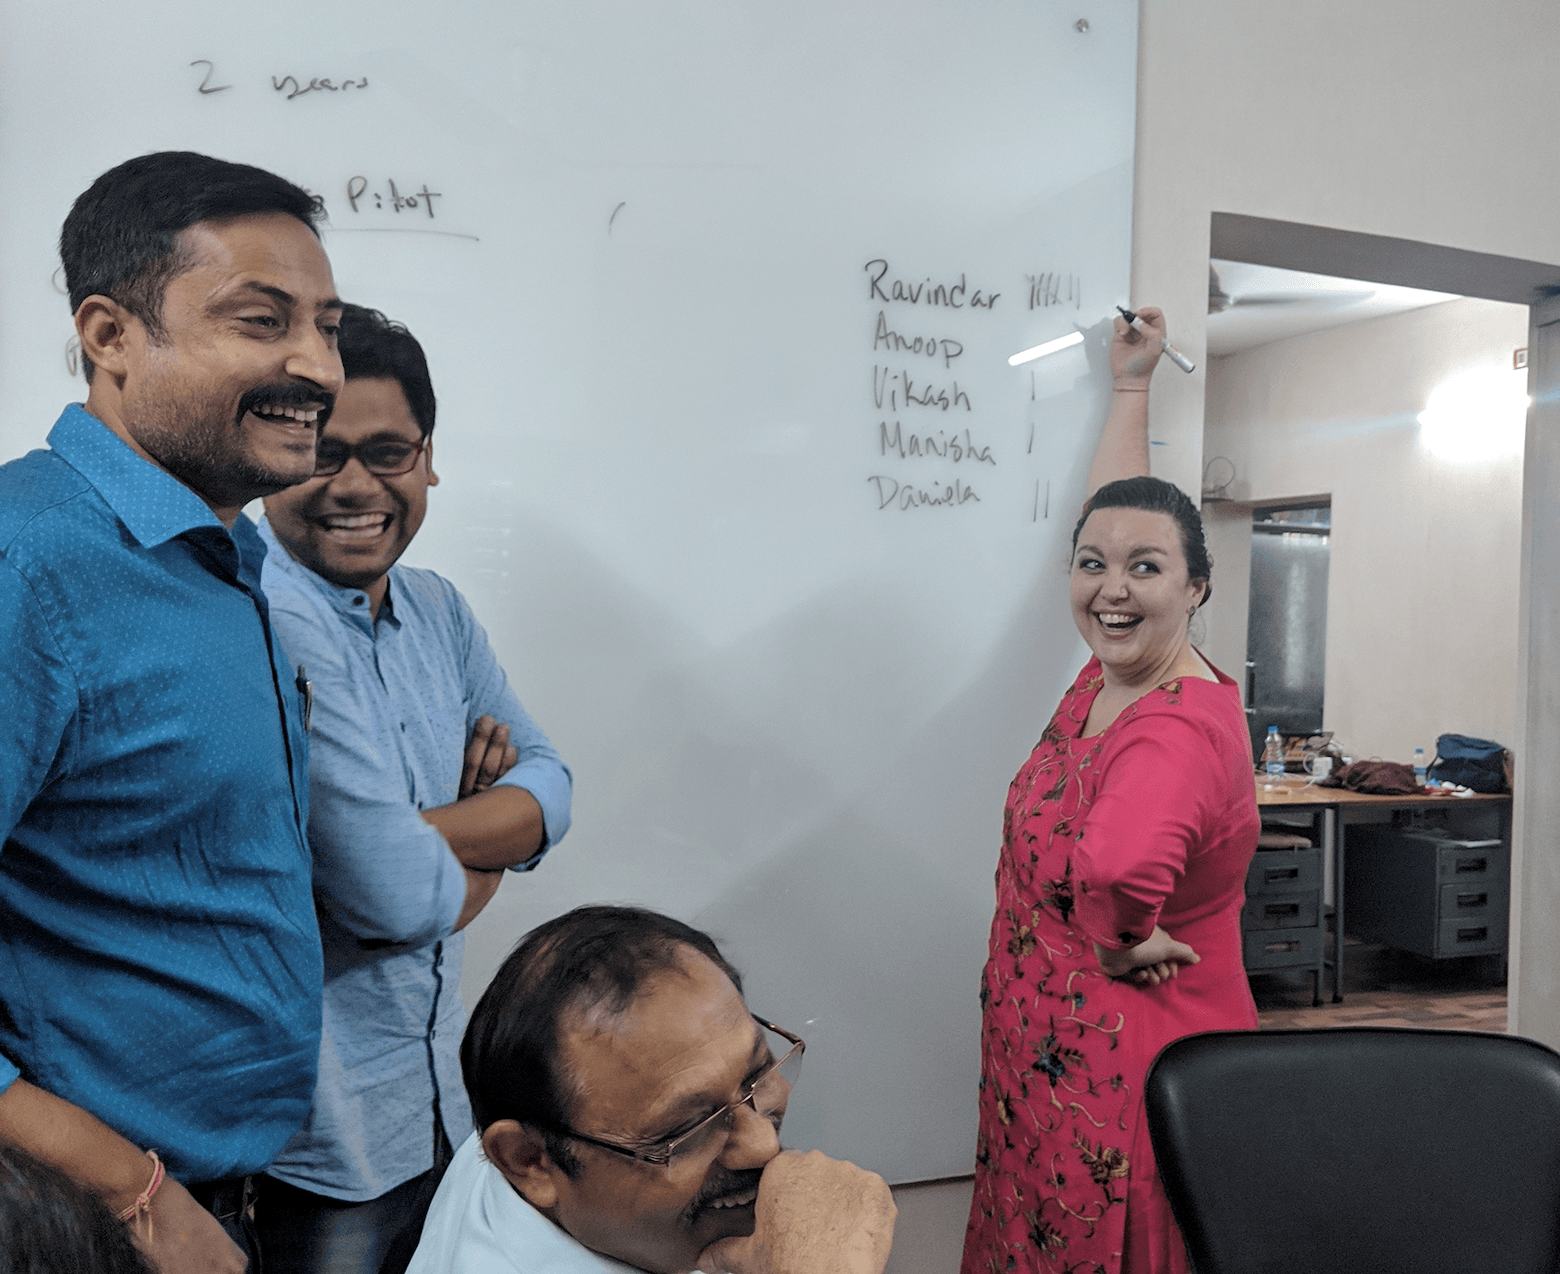
On Michael and Lauren’s last day in the office, we also held an Iron Viz competition for the entire staff. Based on what they had learned over the previous three weeks, the OpASHA employees used the data source given to them to come up with exciting visualizations! The entire office voted on their favorite viz and prizes were gifted to the winners.
While it was difficult to part, we look forward to staying in touch with Lauren and Michael, and continuing our exciting work with the Tableau Foundation in the years to come. We envision using the insights derived from analyses made with Tableau for a wide variety of purposes, with the goal of increasing the efficiency of OpASHA’s programs. That is what all of us show up to do, together, improving the lives of TB patients and making this world a little better each day.
Historias relacionadas
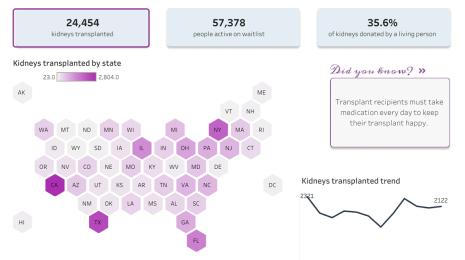
From Kidney Donation to Tableau Dashboard
 25 Octubre, 2022

Using data to drive conversations about climate change
 28 Abril, 2022