How to Get Started Analyzing Football Data in Tableau


Rob Carroll, a technical solutions manager at The Information Lab, is passionate about Tableau and football analytics, having worked in the sports industry previously. Connect with Rob on Twitter and YouTube.
Football—or soccer in the U.S.—has gone through a data revolution in the last 10 years. Analytics are now used across all aspects of football, from the marketing departments to the monitoring of all aspects of training and matches.
In the 2022 World Cup, all clubs will have teams of analysts working around the clock to analyze their own team’s performance. From match events like shots, corners and passes to the physical elements of how far the players have run and how many sprints they have completed—every aspect of every game will be analyzed.
Teams must quickly identify and feedback data insights to coaches and players during the days between each match. They’re also looking at their next opponents, seeking out their strengths and weaknesses to give their team a competitive edge.
What are some examples of football analytics?
There are infinite ways to look at football data and uncover valuable perspectives, but three areas where we see football analytics being used extensively are in team-level, player-level, and play-level performance.
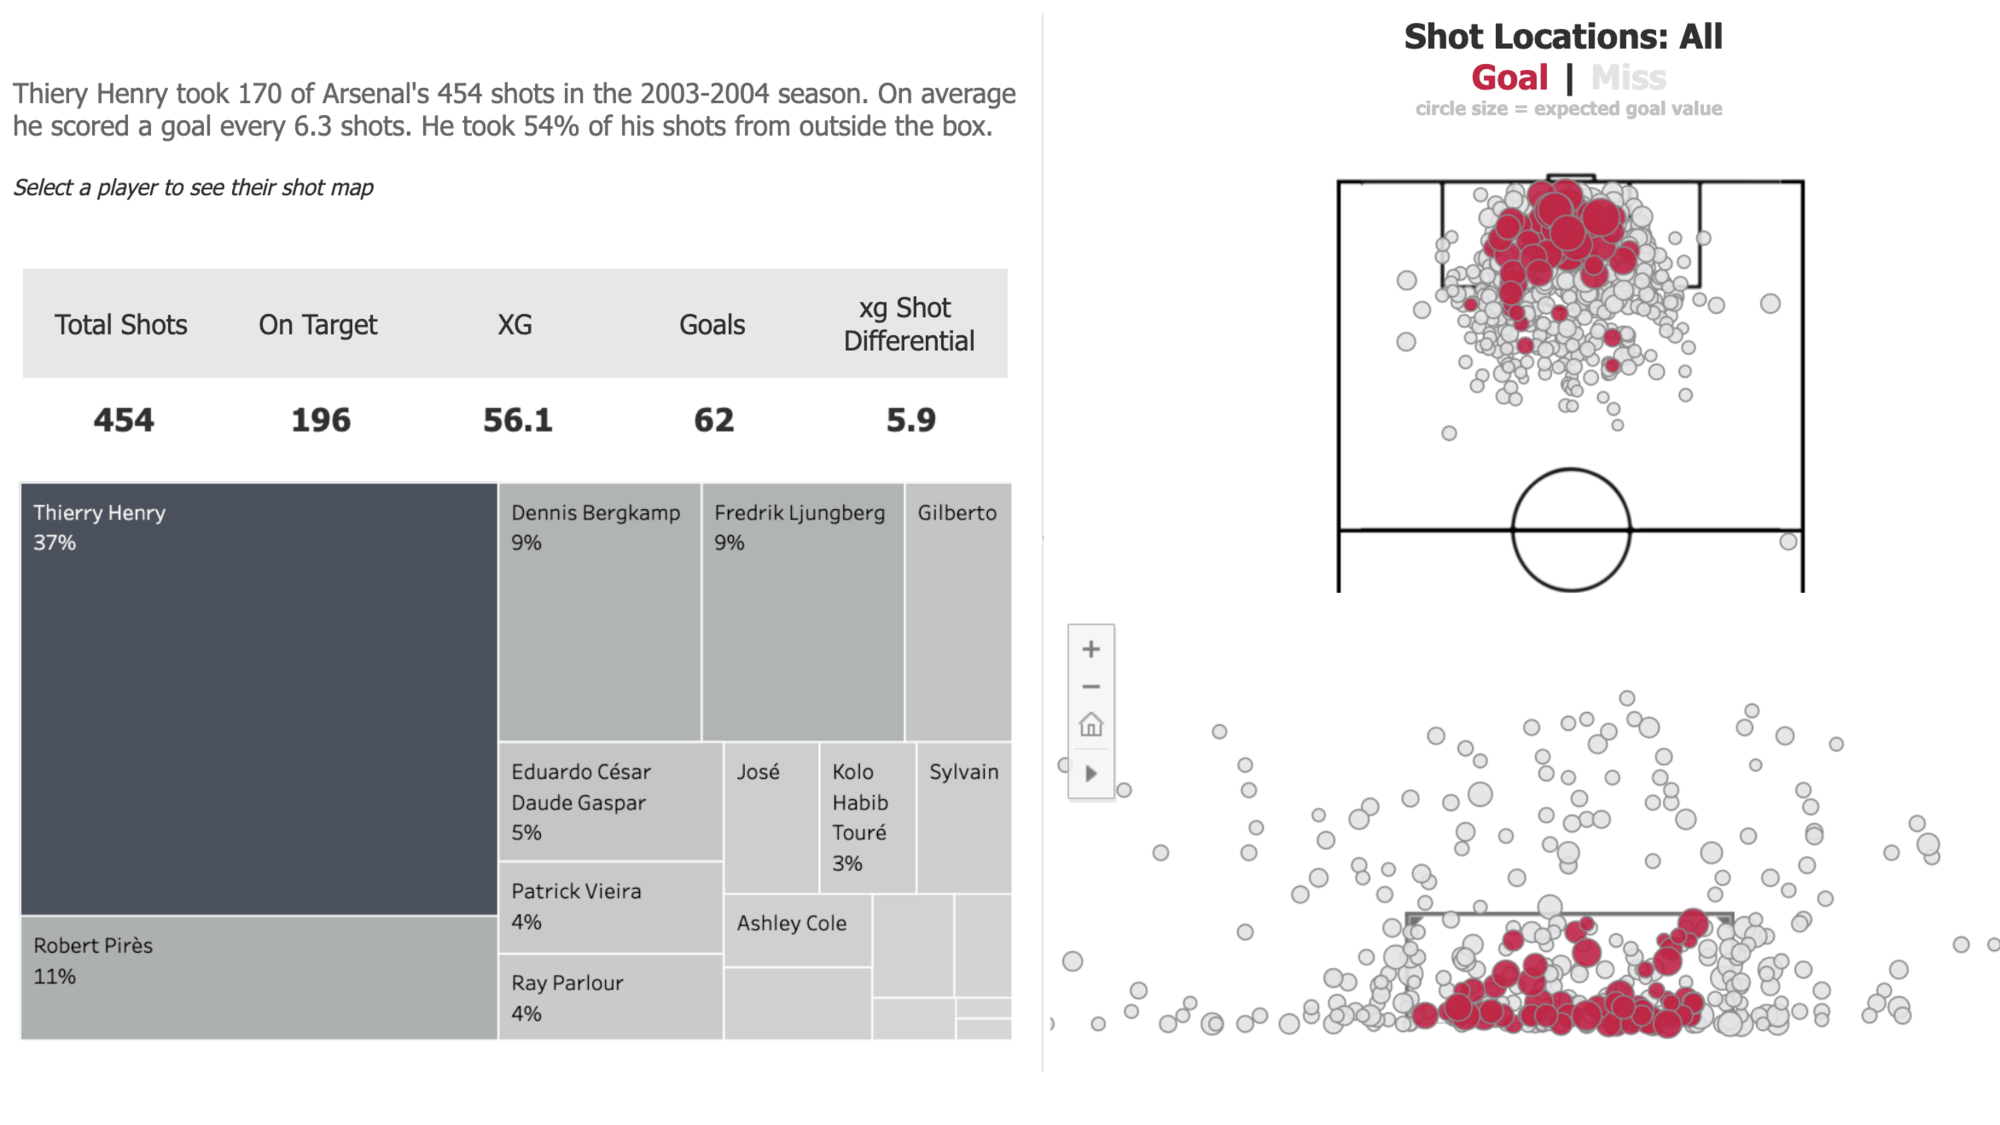
Team-level analytics
Looking at team-level data can help teams see how they measure up relative to specific opponents or teams in their division. The dashboard below looks at shooting by players.
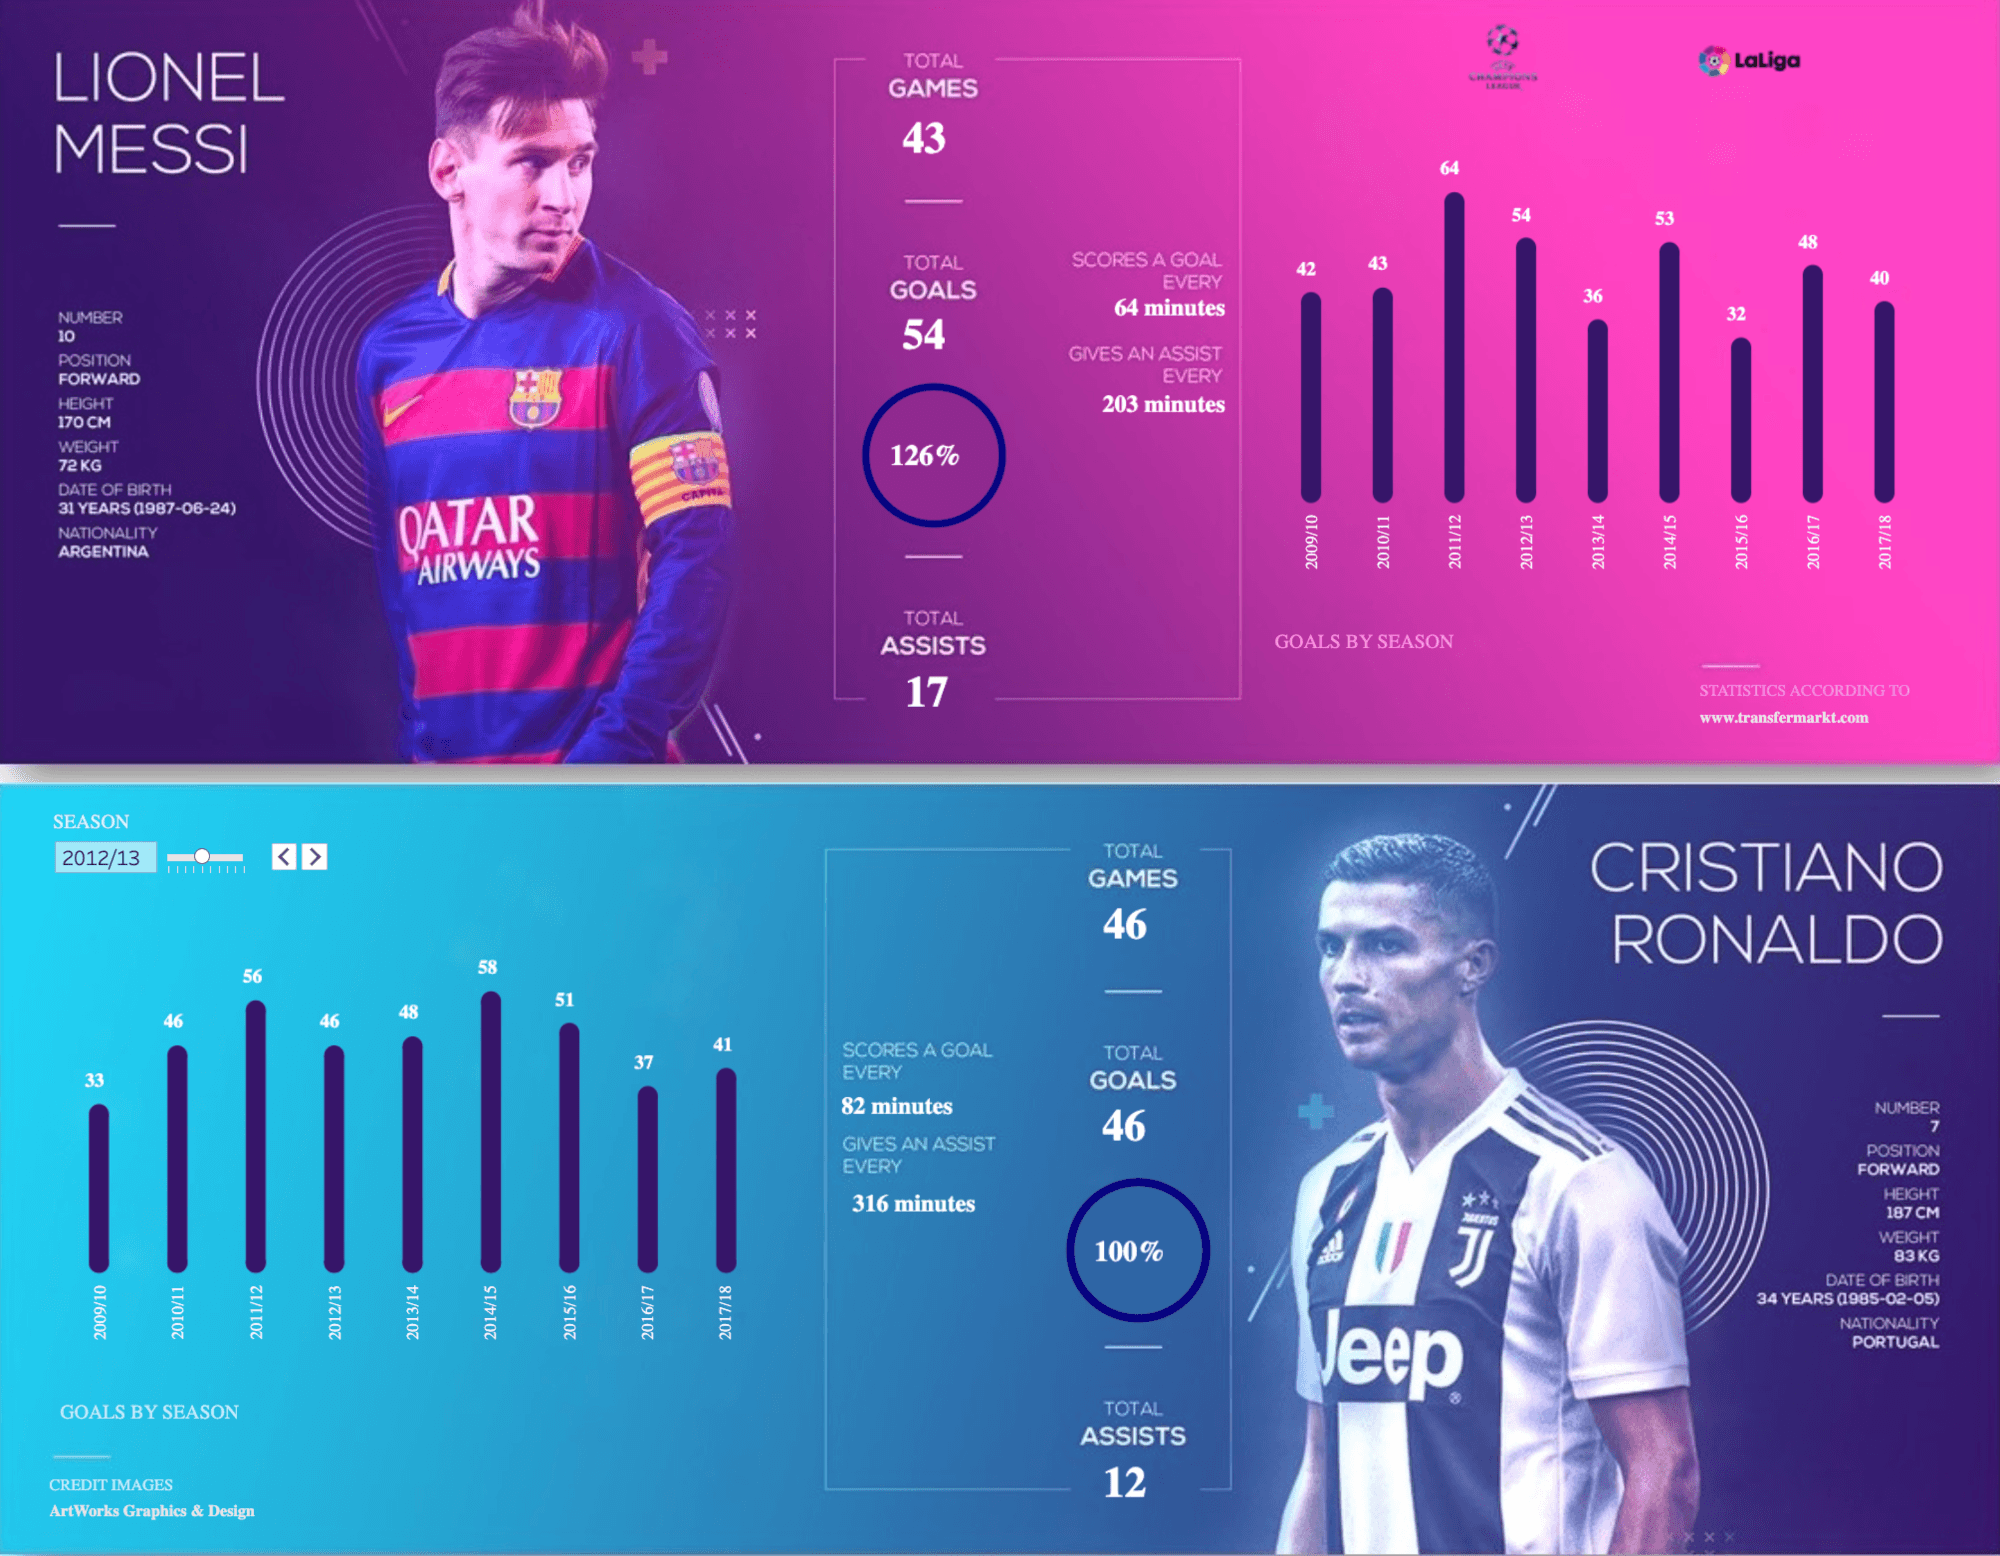
Player-specific analytics
Teams make decisions around recruitment, training, and substitution by looking at the performance of individual players. The dashboard below looks at two of the sport’s super stars.
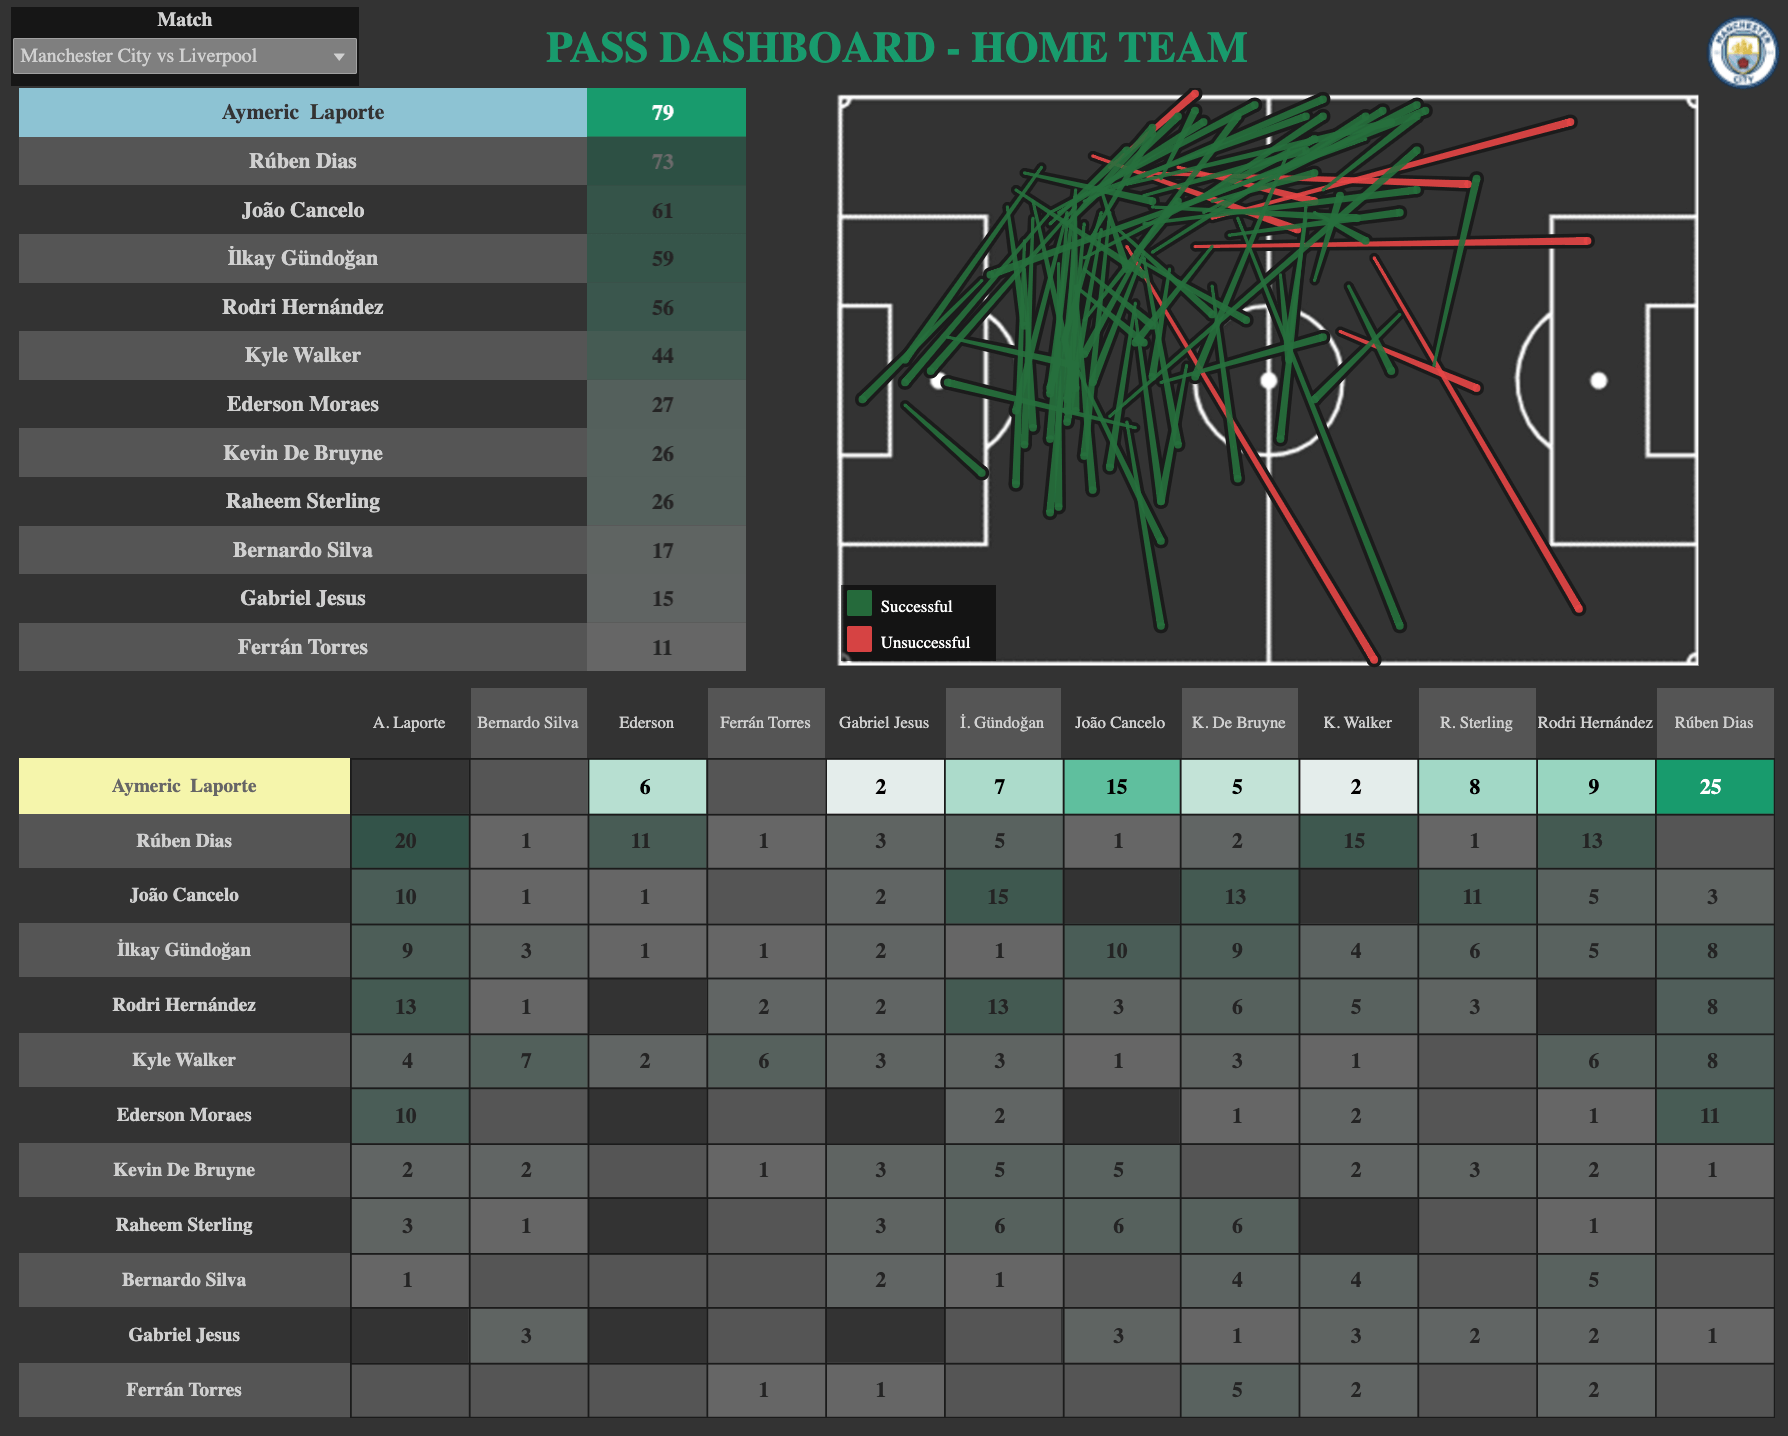
Play-level analysis
With data on the location of players and the ball, Clubs now look at every second of play in search of insights about what helps teams improve their expected results. This play-level analysis has changed how many teams approach corner kicks, throw-ins, and shooting–and almost every aspect of play. The dashboard below looks at the passing tactics of Premier League players by game.
What are some resources to get started analyzing football data?
The Tableau Community has a wealth of resources to accelerate your football and soccer analytics journey.
If you’re just getting started, I’ve curated a list of video resources that will walk you through from the very first time you open Tableau to being able to create pass maps. A few other great places to get started are learning how to build a simple scouting dashboard here or a season summary dashboard here.
If you’re looking for more step-by-step instructions, guides and advanced-visualization content, Tableau is also lucky to have incredible football and soccer analytics tutorials created by CJ Mayes, Ninad Barbadikar, Swaminathan Nanda-Kishore, and Rahul Iyer. Make sure to subscribe to the Community Newsletter to see more of this content as it
As you’re looking for data for your next great analysis, make sure to check out the resources available from FIFA, FB Ref, and Statsbomb. If those resources don’t have what you’re looking for, then consider using Python to scrape and prepare data. I highly recommend the free resources at FC Python, a project that makes the programming accessible to sports enthusiasts with no experience.
My other recommendation would be to find interesting visualizations on Twitter and see if you can replicate them in Tableau. This is how I learned and got better at using Tableau. Obviously give credit to the original, but testing and stretching your skills by learning from the community is a really powerful way to improve your skills.
What advice do you have for someone starting a career in football or soccer analytics?
My #1 tip for starting a career in football or sports analytics is to produce work. You would be amazed at the number of people working for teams who got noticed because of the public work they produced.
Starting a Twitter account or a blog gives you an opportunity to show off your skills, whether that be in the data engineering field, data visualization or even data science and model building.
To read more about a football analyst’s experience getting started in the industry, read about Liam Henshaw’s blog, “How to get started in data and the football industry“ and don’t miss his vizzes on Tableau Public.
How should newcomers connect with the Tableau football and soccer analytics community?
The community project Sports Viz Sunday is also a great place for inspiration, data sets and an opportunity to meet other Tableau sports enthusiasts. Some examples of Sports Viz Sunday football datasets include Premier League shooting, Football European Championships results, and Women’s World Cup history. The project’s weekly roundups are a great way to get new analysis ideas and find people to follow.
Tableau’s Football User Group is another great place to connect with the industry. The quarterly meetings feature practitioners sharing their expertise in areas like recruiting, business operations, and analytics strategy. Be sure to check out recordings of their prior meetings on YouTube.
Football and soccer analytics dashboards from Tableau Public
If you’re a sports data fan like me, then you love a good dashboard. I’ve curated a collection of football vizzes below: Most are downloadable so you can see how they are made and learn how to build it yourself. If you don’t see something below that you’re looking for, be sure to search Tableau Public and you’ll likely land on something close. Happy vizzing!
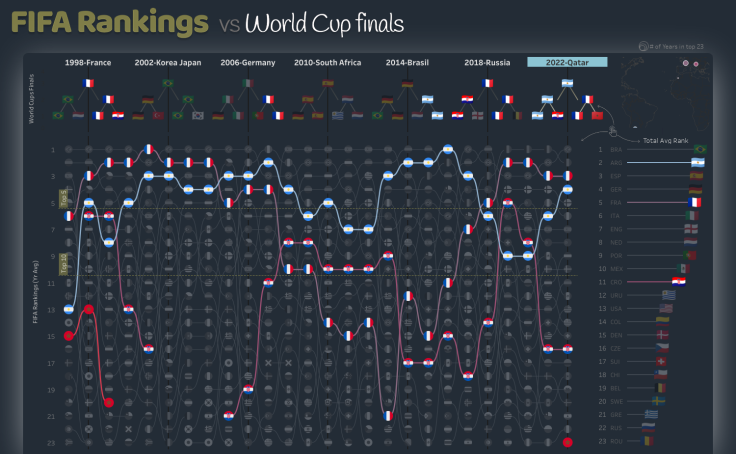
FIFA rankings vs World Cup Finals

The History of the Football League

Football Scouting Tool Dashboard

Liverpool 2019-20 Champions

Going for Goal

Declan Rice - #IronViz

FIFA WORLD CUP


World Cup story

Iron Viz - FIFA
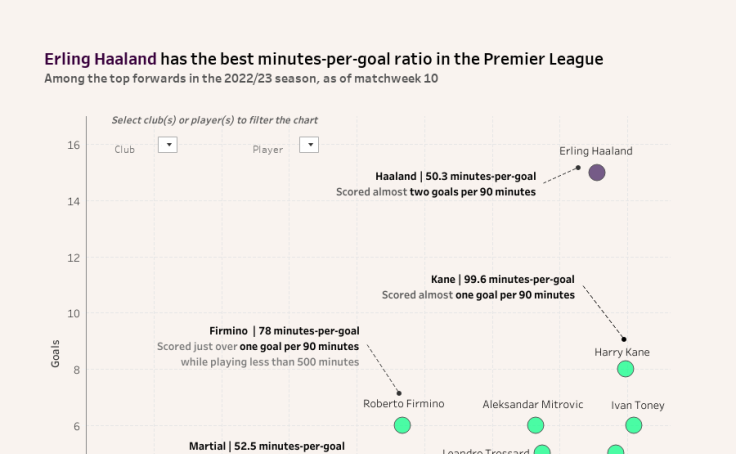
Premier League Minutes Per Goal Ratio

World Cup 2022 Squad Age Distributions

#SportsVizSunday_Jan2021_WSLShotsGoals

How has the WSL table changed over the season?

Sergio Ramos & his 24 Red Cards

World Cup 2018: Match Dashboard

Football Transfer Window Analysis 22/23 (condensed)


Time v Quality of Shooting
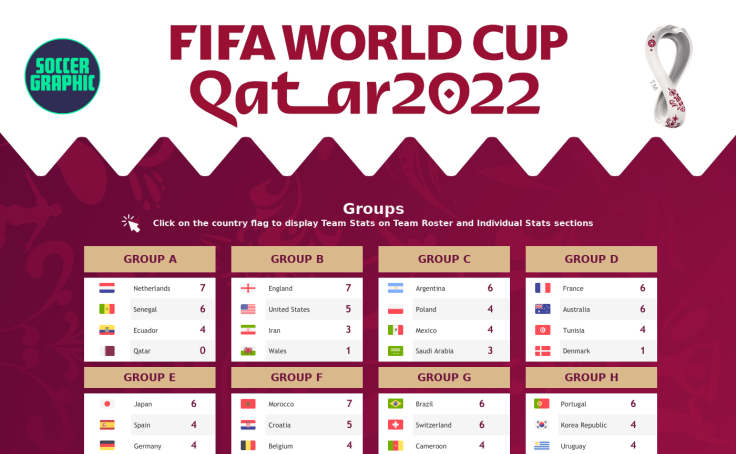
Soccer World Cup Qatar 2022
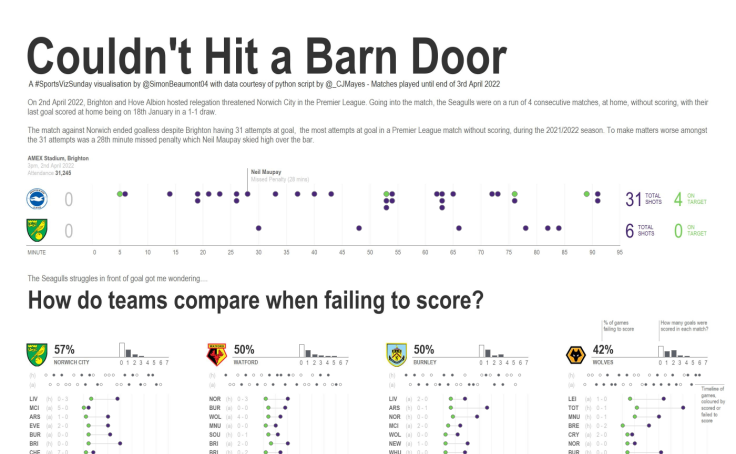
#SportsVizSunday - Couldn't Hit a Barn Door

Passes and Shots

US Men's Soccer World Cup Qualifying 2022

FIFA 20 Attacking and Defending Stats

World Cup 2022 Minutes Contributions
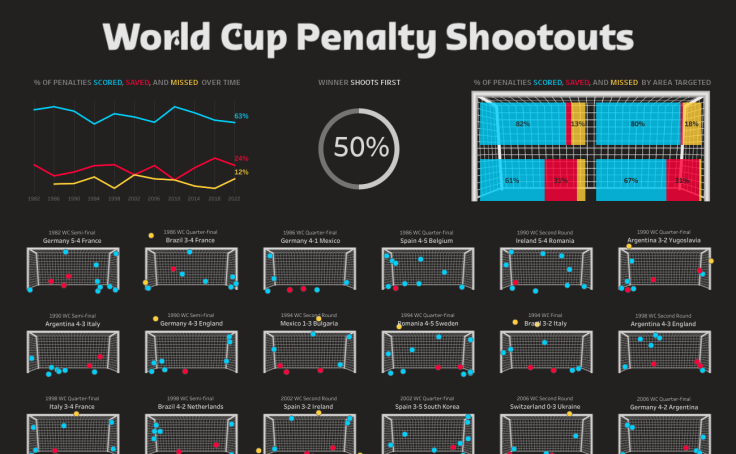
World Cup Penalty Shoot-outs

A History of the World Cup
Historias relacionadas

9 Tips to Succeed in a Tableau DataDev Hackathon
 8 Enero, 2025

A Guide to Mapping and Geographical Analysis in Tableau
 15 Noviembre, 2024

Making Tables Smarter: Key Features of the Tableau Table Viz Extension
 14 Noviembre, 2024