Todas las historias de
 Product
Now in beta: Visual data prep with Project Maestro
 27 Noviembre, 2017
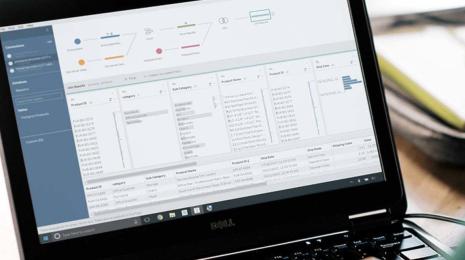
We’re excited to release the first beta of Project Maestro, a new approach for combining and cleaning data.
27 Noviembre, 2017
We’re excited to release the first beta of Project Maestro, a new approach for combining and cleaning data. Data
DataBuild a custom web analytics dashboard with these resources
 22 Noviembre, 2017
In this follow-up to a Tableau Conference breakout session, get all the resources you need to build a web analytics dashboard that's customized to your site. Part two in a series.
22 Noviembre, 2017
In this follow-up to a Tableau Conference breakout session, get all the resources you need to build a web analytics dashboard that's customized to your site. Part two in a series. Tableau Public
Results: IMDA-Tableau NIC Face-Off | Community-Driven Data Stories Competition 2017
 22 Noviembre, 2017
 Data
DataHow analytics can supercharge holiday retail sales
 21 Noviembre, 2017
Thanksgiving weekend kicks off the holiday shopping season in the United States. And once more, retailers will compete for a share of consumers’ gift purchases.
21 Noviembre, 2017
Thanksgiving weekend kicks off the holiday shopping season in the United States. And once more, retailers will compete for a share of consumers’ gift purchases.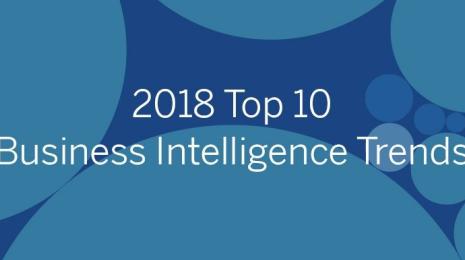 Tableau
Ya tenemos las tendencias de inteligencia de negocios de 2018
 15 Noviembre, 2017
Para comenzar el nuevo año, encuestamos a los expertos de Tableau y compilamos las 10 tendencias principales de inteligencia de negocios que debe tener en cuenta en 2018. Gracias a la ayuda de talentosos ingenieros y administradores de productos veteranos, identificamos las tendencias de inteligencia de negocios que dejarán de ser ideas y pasarán a ser realidad.
15 Noviembre, 2017
Para comenzar el nuevo año, encuestamos a los expertos de Tableau y compilamos las 10 tendencias principales de inteligencia de negocios que debe tener en cuenta en 2018. Gracias a la ayuda de talentosos ingenieros y administradores de productos veteranos, identificamos las tendencias de inteligencia de negocios que dejarán de ser ideas y pasarán a ser realidad.
 Tableau Cloud
Calling all Cloud customers and enthusiasts! What to expect at AWS:reInvent 2017
 15 Noviembre, 2017
Tableau is excited to partner with AWS at their annual Customer and Partner Conference, AWS re:Invent, which will happen in Las Vegas November 27 - December 1, 2017.
15 Noviembre, 2017
Tableau is excited to partner with AWS at their annual Customer and Partner Conference, AWS re:Invent, which will happen in Las Vegas November 27 - December 1, 2017.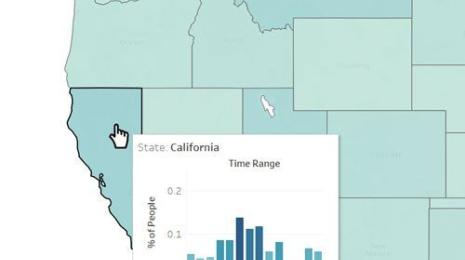 Product
Viz in Tooltip is here!
 15 Noviembre, 2017
In our upcoming Tableau 10.5 release, we’re proud to deliver on our promise of hosting incredible visualizations in tooltips. Not only is this feature an engaging form of viz interactivity, it’s also a fantastic way to augment your dashboards and stories with relevant data without introducing more clutter.
15 Noviembre, 2017
In our upcoming Tableau 10.5 release, we’re proud to deliver on our promise of hosting incredible visualizations in tooltips. Not only is this feature an engaging form of viz interactivity, it’s also a fantastic way to augment your dashboards and stories with relevant data without introducing more clutter. Enterprise
The 5 phases of today’s analytic workflow
 10 Noviembre, 2017
A modern analytics approach is critical to glean beneficial data insights
10 Noviembre, 2017
A modern analytics approach is critical to glean beneficial data insights
 Enterprise
IT increase adoption and scale Tableau across Daimler
 7 Noviembre, 2017
We asked Benjamine from Daimler AG to share his learning and tips around implementing an enterprise-wide Tableau deployment.
7 Noviembre, 2017
We asked Benjamine from Daimler AG to share his learning and tips around implementing an enterprise-wide Tableau deployment.