7 Stats to Watch on Your Tableau Public Profile


As you build your Tableau Public profile and grow your network, you may be curious about your stats or how your vizzes are performing. Beyond favorites and follower counts, these metrics offer insights into the impact of the vizzes and portfolio you’ve created. Whether you’re jumpstarting a career in data analytics, learning new skills, or simply connecting with the DataFam - we’ve outlined 7 stats to watch to support you in achieving your goals.
Viz Stats - Stats You’ll Find on Your Viz
To see the individual stats for each viz, navigate to any of the viz cards on your Tableau Public profile to view:
Favorites
Any viz publicly published to your Tableau Public profile can easily be favorited by another logged in user with a click of a button. Users can select the star symbol to either ‘add favorite’ or ‘remove favorite’. On each individual viz card, you will find the total number of users who have favorited that specific viz.
Views
The total number of views for a viz are displayed directly on the viz card. Views represent the total number of users who have clicked through to view your viz on the viz homepage. This view count also includes views from websites or blogs you may have embedded your viz on.
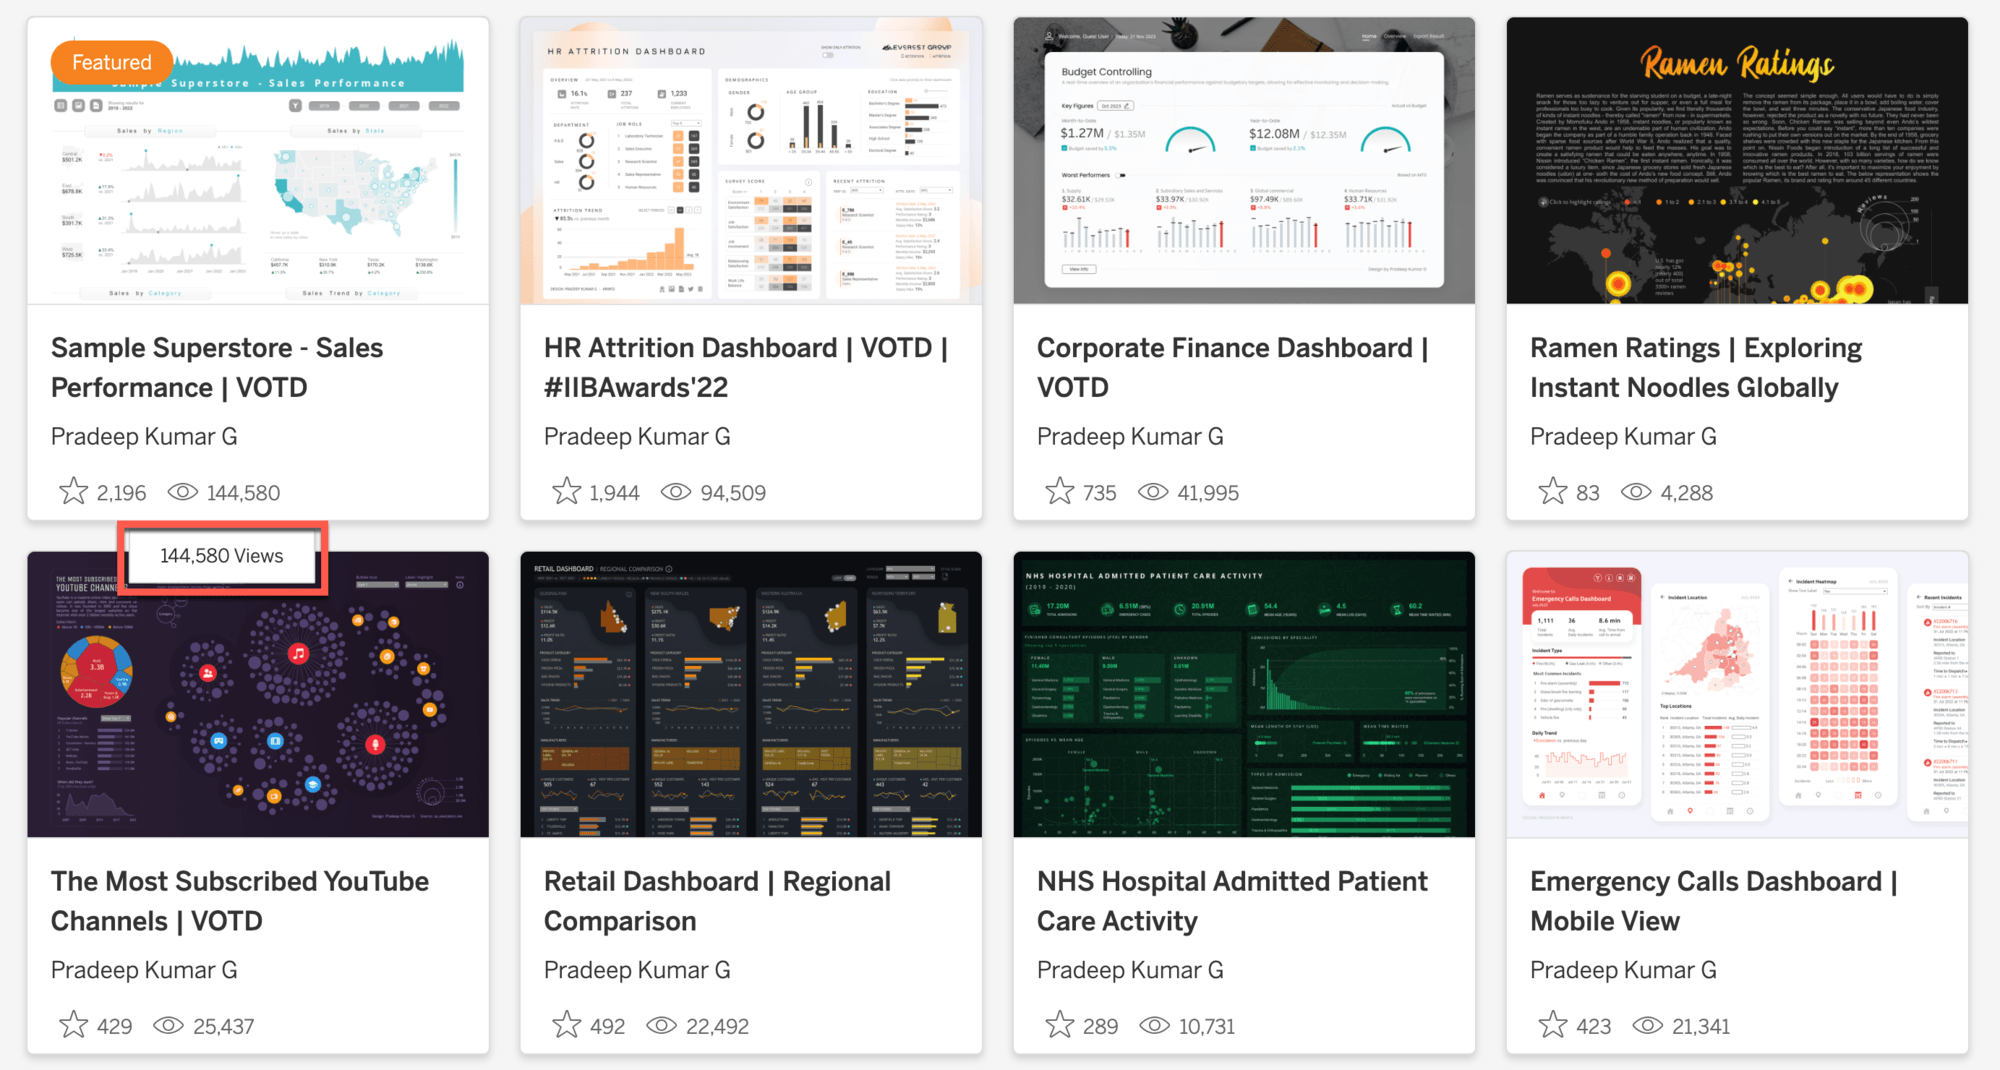
Pro tip: Want to get more eyes on a viz that you’re proud of? Feature it on your profile! Toggle on ‘Feature Viz on Profile’ to have that viz moved to the top of your profile!
Enhanced Stats - Stats You’ll Find on Your Profile
To find the stats overview on your profile, log in and go to your profile page. Under the ‘Stats’ tab you’ll find your personalized 30-day metrics. By clicking each metric, you can drill down even further to see how your metrics changed.
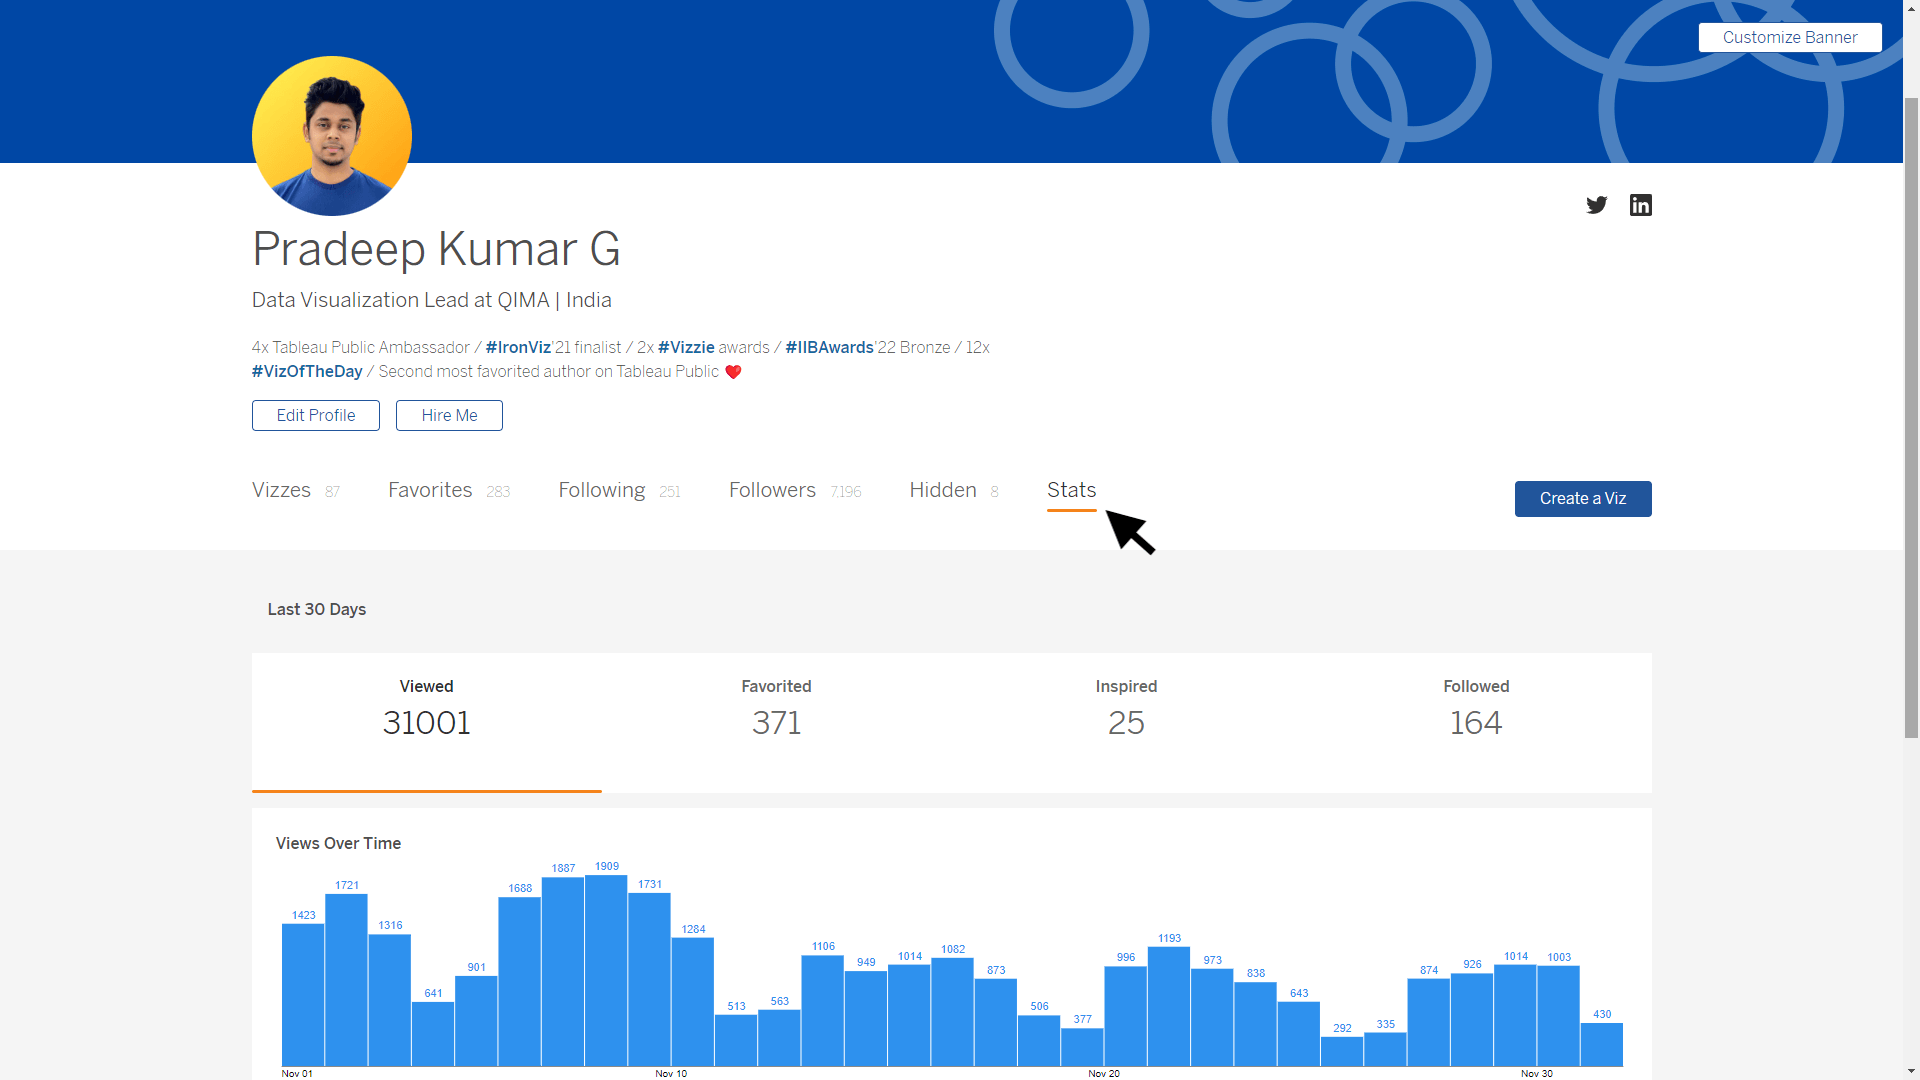
Viewed
This number represents the total number of views across all of the vizzes on your profile. You will find an increase or decrease percentage depending on how your profile has performed over the 30-day time period.
Favorited
‘Favorited’ is the total favorites across all of your vizzes over the last 30 days. This percentage will change depending on how many of your vizzes have been favorited or unfavorited by other authors.
Inspired
When you publish a viz to your Tableau Public profile, you have the option of allowing other users to copy or download your viz to see how it was made for inspiration. (If you’d like to enable or disable this functionality, you can go to the settings on each individual viz and toggle on or off ‘Allow access’.) The ‘Inspired’ metric on your Stats dashboard tells you the number of vizzes published by others in the last 30 days that credit your visualization as inspiration.
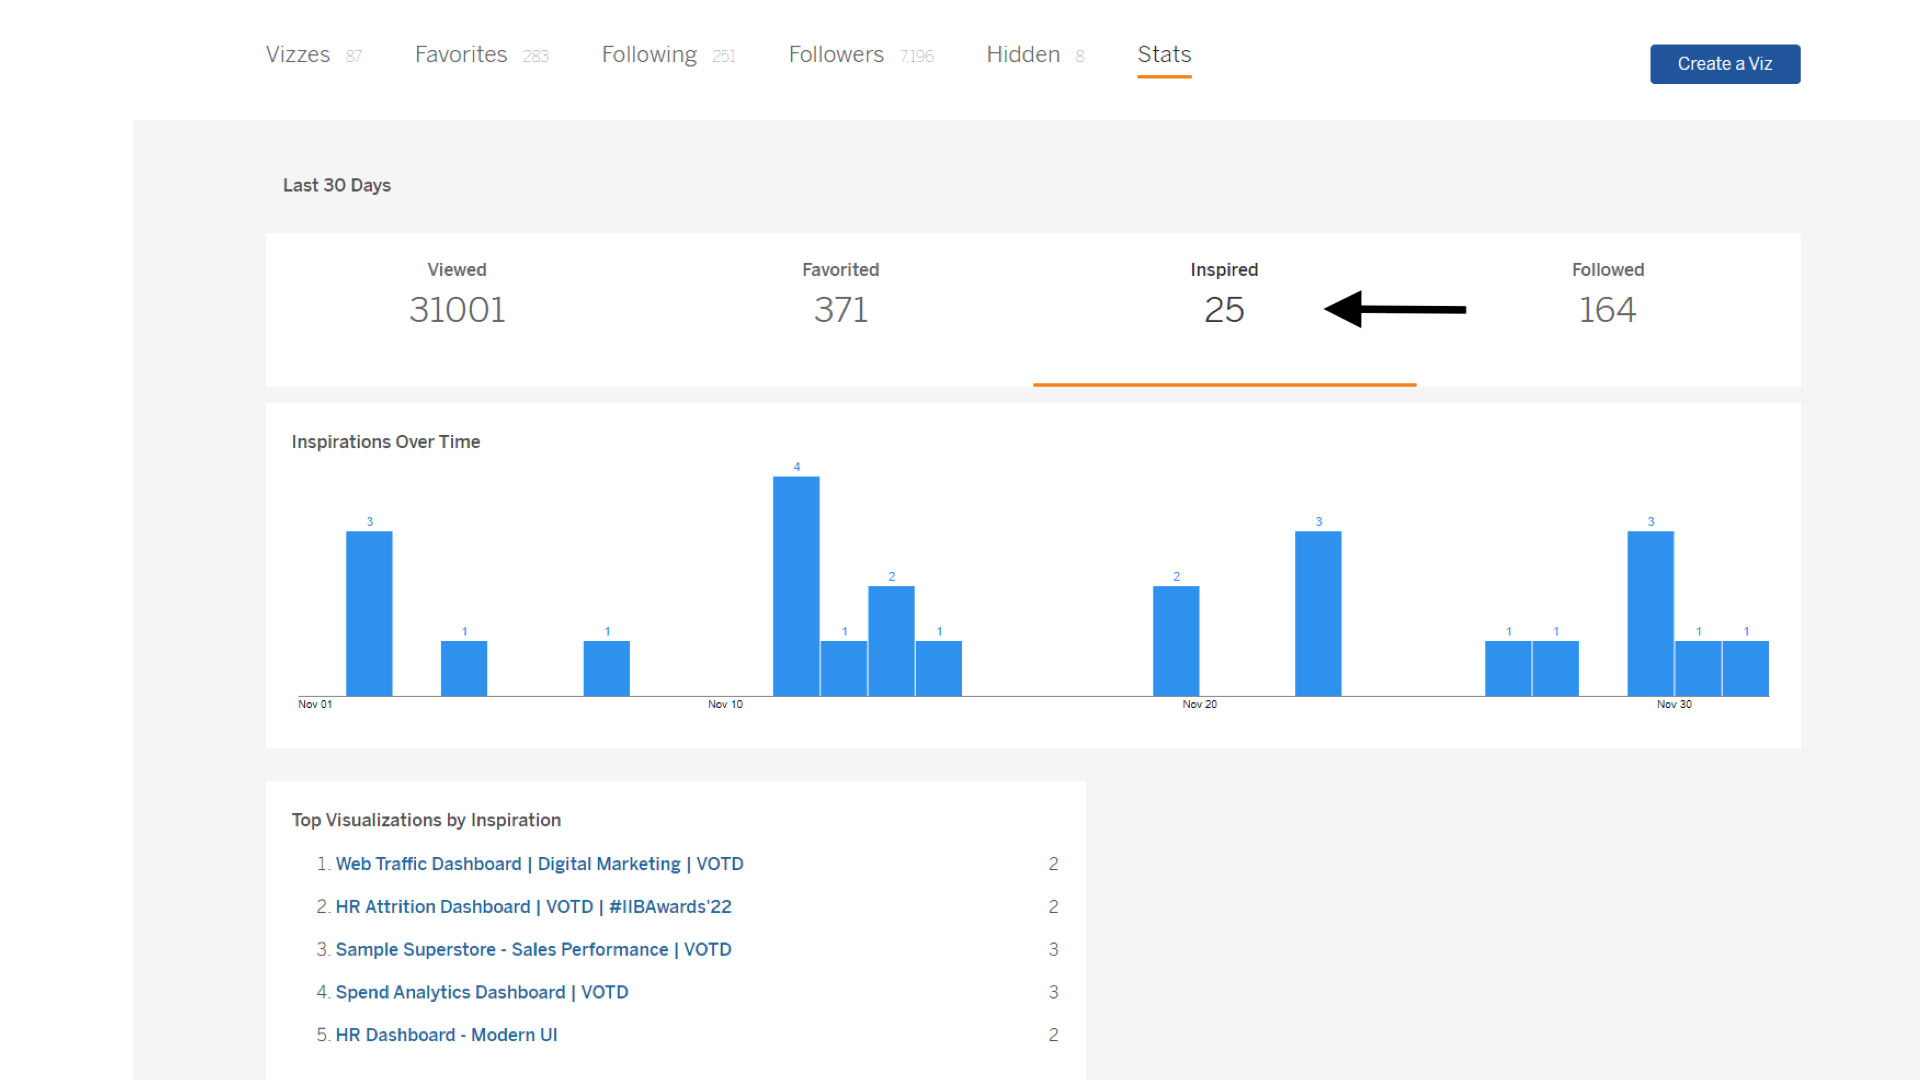
Pro tip: Allowing others to copy your viz is a great way to support learning in the DataFam community!
Followed
The ‘Followed’ metric is the number of followers you have on Tableau Public, with updates on how your following count may have changed in the last 30 days. For quick access, you can also see your total followers in the top navigation of your profile page.
Top 5 Vizzes
Here you’ll find the top 5 vizzes on your profile from the last 30 days that you can filter by views, favorites, and most inspiring. This is a great way to quickly identify your most popular vizzes and what type of content performs best.
Pro tip: Get ready to show off those data skills! Share your progress on your social media accounts to get even more engagement from your network.
Ready to dive in? Log in to your Tableau Public account to explore your own viz and profile metrics and feel free to share your insights with the DataFam on social!
Historias relacionadas

Iron Viz 2026: Read Between the Data
 28 Mayo, 2026

Tableau's Iron Viz Winners

Explore the 2026 Iron Viz Entries
 15 Diciembre, 2025