Visualizing KEXP: 18 years of playlist data that shaped Seattle music history


Over the summer, we introduced Data + Music—a collection of visualizations produced by our incredible Tableau community. The project showcased the data behind beloved bands, songs, genres, and tours.
It has been such a billboard hit, we decided to turn up the volume. We reached out to our friends at KEXP, a global radio station located in Seattle, to see if they would be interested in collaborating on a data visualization contest for our Tableau employees. They graciously provided 18+ years of playlist data. The result was a series of fascinating visualizations about KEXP’s airtime history, revealing insights into DJ’s changing music tastes over time and a balance of tracks between both local and global artists.
View the top five visualizations from the contest below and check out our livestream with contest winner, Ria Montenegro, along with KEXP DJs Larry Rose and DJ Morgan.
Top 5 KEXP Visualizations: Showcasing the data behind the music that matters
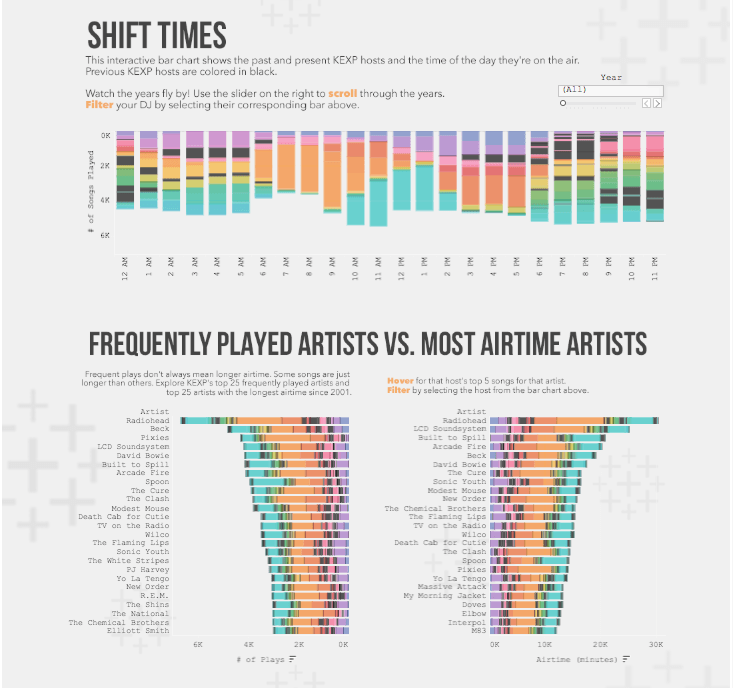
1. The Data Behind Where the Music Matters | 18 Years of KEXP
Author: Ria Montenegro, Legal Contract Manager — Seattle, WA
Ria Montenegro explored KEXP DJs to find out their most played artists and the times of day they are on the air. Are you wondering who plays your favorite tunes and when? Check out her viz to find out.
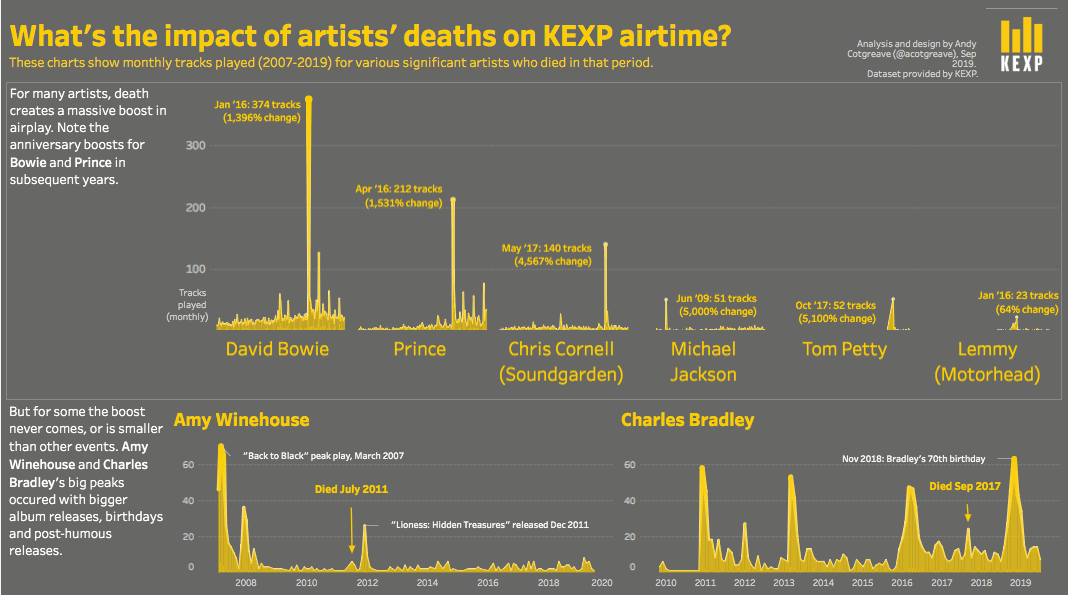
2. Artist Deaths: Impact on KEXP Airtime
Author: Andy Cotgreave, Technical Evangelist Director — London
The beat goes on, so they say. When artists pass away, you’ll often see a skyrocketing in airplay. Andy Cotgreave inspected how an artist's death affects when DJs play their songs on KEXP. Check out his viz to see for yourself and watch the livestream for more insights—and a story about David Bowie—from Larry Rose and DJ Morgan.
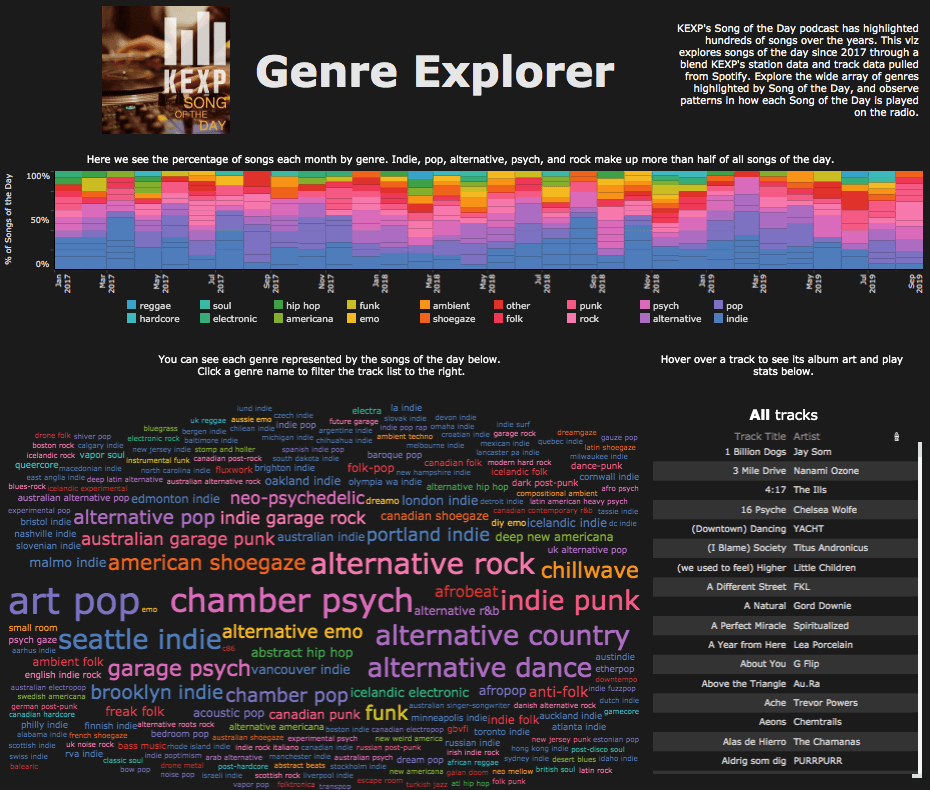
3. KEXP Song of the Day “Genre Explorer”
Author: Mia DuBose, Software Engineer — Seattle, WA
KEXP's Song of the Day podcast has highlighted hundreds of songs over the years. Indie, pop, alternative, psych, and rock make up more than half of the list. Explore Midora's viz to discover the percentage of songs each month by genre, patterns, and play stats.
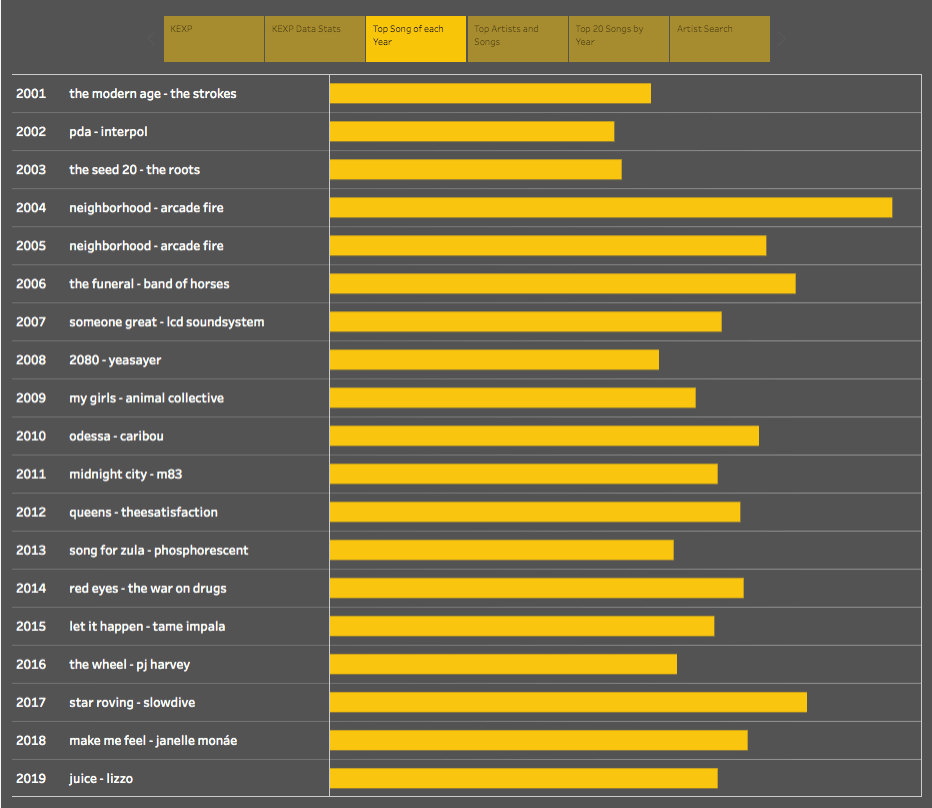
4. Exploring 18 Years of KEXP Data
Author: Nicolas Bock, Senior Software Engineer — Palo Alto, CA
Nicolas Bock's viz focused on KEXP trends over the last 18 years. Put your love of music to the test and see if you can identify the top songs of each year and top artists. Spoiler alert—Radiohead has stood the test of time.
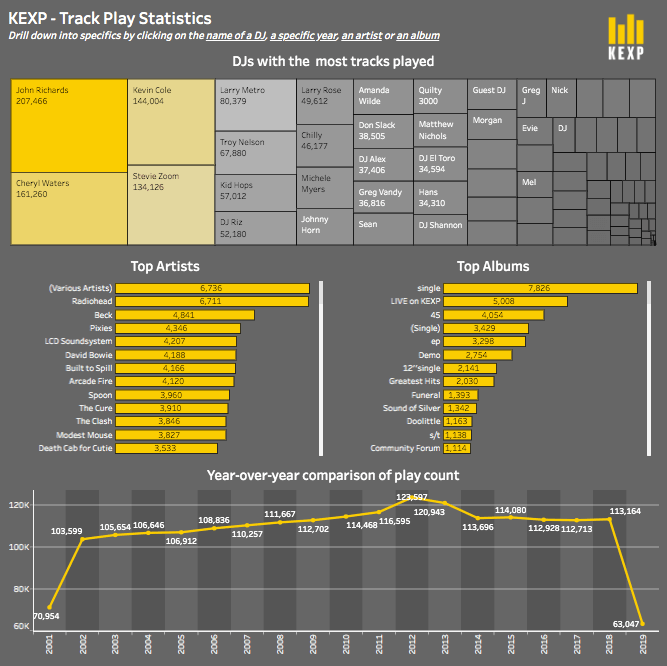
5. KEXP Track Play Statistics
Author: Ajay Sundaresh, Senior Software Engineer — Kirkland, WA
Ajay Sundaresh wanted to learn more about track play statistics for KEXP DJs. Dig into his viz to see which DJ has the most tracks played, top artists and albums, and get a year-over-year comparison of play count.
Dig into more music data
Explore all of our visualizations in our Viz Gallery to find more insights into this amazing dataset from our friends at KEXP.
And explore our Data + Music web experience for more stories about the bands and musicians you love.
Finally, we want to say a big thank you to the following employees who submitted a visualization to our employee contest:
- Jeff Raymakers (Seattle)
- Florian Ramseger (Frankfurt)
- Leslie Tsai (Palo Alto)
- Steph Dietzel (London)
- Robin Elwick (Seattle)
- Craig Fisher (Kirkland)
- Kevin McCabe (Seattle)
Historias relacionadas

DataFam Roundup June 2026

DataFam Roundup May 2026

Iron Viz 2026: Read Between the Data
 28 Mayo, 2026