DataFam Roundup October 2025


Welcome! Dig into this month's DataFam Roundup—a monthly blog that brings together community content all in one post. As always, we invite you to send us your content—and the DataFam content from your peers that have inspired you! To send us your content, join the Tableau Community workspace on Slack and join the #community-share channel.
Community Highlight
To recognize new and consistent Tableau contributors—we’re excited to have a section within the monthly DataFam Roundup called the Tableau Community Highlight. Find out how to get involved.

Jennifer Eneh, Data Analyst
Abuja, Nigeria
Jennifer Eneh is a Data Analyst. Her journey with Tableau began with a YouTube tutorial that inspired her to build her own dashboard, which quickly grew into active community participation. Inspired by positive feedback, she dove deeper into learning through others' work and videos. Today, Jennifer contributes to the community by writing blogs that address common challenges and volunteering for the Lagos Tableau User Group in Nigeria, aiming to make the learning process easier. She engages through various channels, including TUGs, Tableau Public, X, and the Tableau Community Forums.
Her blog, driven by the belief that "the best kind of learning happens through teaching," helps solidify Jennifer’s understanding while aiding others. She draws inspiration for her Tableau Public dashboards from a variety of sources, including Tableau Public and Pinterest. Jennifer shares her expertise through blogs, resources, virtual teaching, and design feedback, motivated by the support she initially received. Looking ahead, she plans to continue to develop her data skills, create more vizzes, and continue her contributions to the community.
Connect with Jennifer on Linkedin, X, Tableau Public, and on her blog.
DataFam Content
- Adam Mico: 50 Tableau Fun Facts from Tableau Virtuoso GPT
- Annabelle Rincon & Adam Mico: DIY: Countdown to Christmas with Data!
- Brittany Rosenau: Be Part of the First Dreamforce ‘25 Step Tracker Project!
- Darragh Murray: How to Do Reasonably Well in Data Visualisation Competitions
- Jim Dehner: Getting to Know Parameters and How They are Used
- Louis Yu & Will Sutton: IronVIz: Let’s Feast!
- Matt Huff: Reinventing the Humble Bar Chart
- Rod Sardari: How to Connect ArcGIS Living Atlas to Tableau
- Steve Adams: The Deli Dashboard Principle
- Tim Ngwena: Taking a Tour of Tableau Next: Part 1 Overview
- Tore Levinsen: TinyTableauTip - Guest Host Zyad Wael
- Chris Westlake:
- Deepak Holla
- Tableau’s Color Logic: The Real Rule Behind Every Color
- Why Tableau Automatically Aggregates Your Data (and How to Control It)
- Say Hello to the Dashboard || #Tableau "Say Hello" Series
- Tableau Basic Terminology: What are Fields, Members and Values in Tableau?
- Tableau Desktop and Tableau Prep Builder
- Tableau Basic Terminology: What is a Hierarchy!
Team Tableau Content
- Iron Viz Qualifiers are Open until November 21. Submit your story of Food & Drink through data
- Tableau 2025.3 is Coming Soon
- Watch the Tableau Keynote at Dreamforce #DF25
- Catch up on Tableau Sessions from Dreamforce #DF25
- The Agentic Enterprise Starts With What You Already Have
- Inside Track: Proactive Insights and Viz Updates
Visualizations
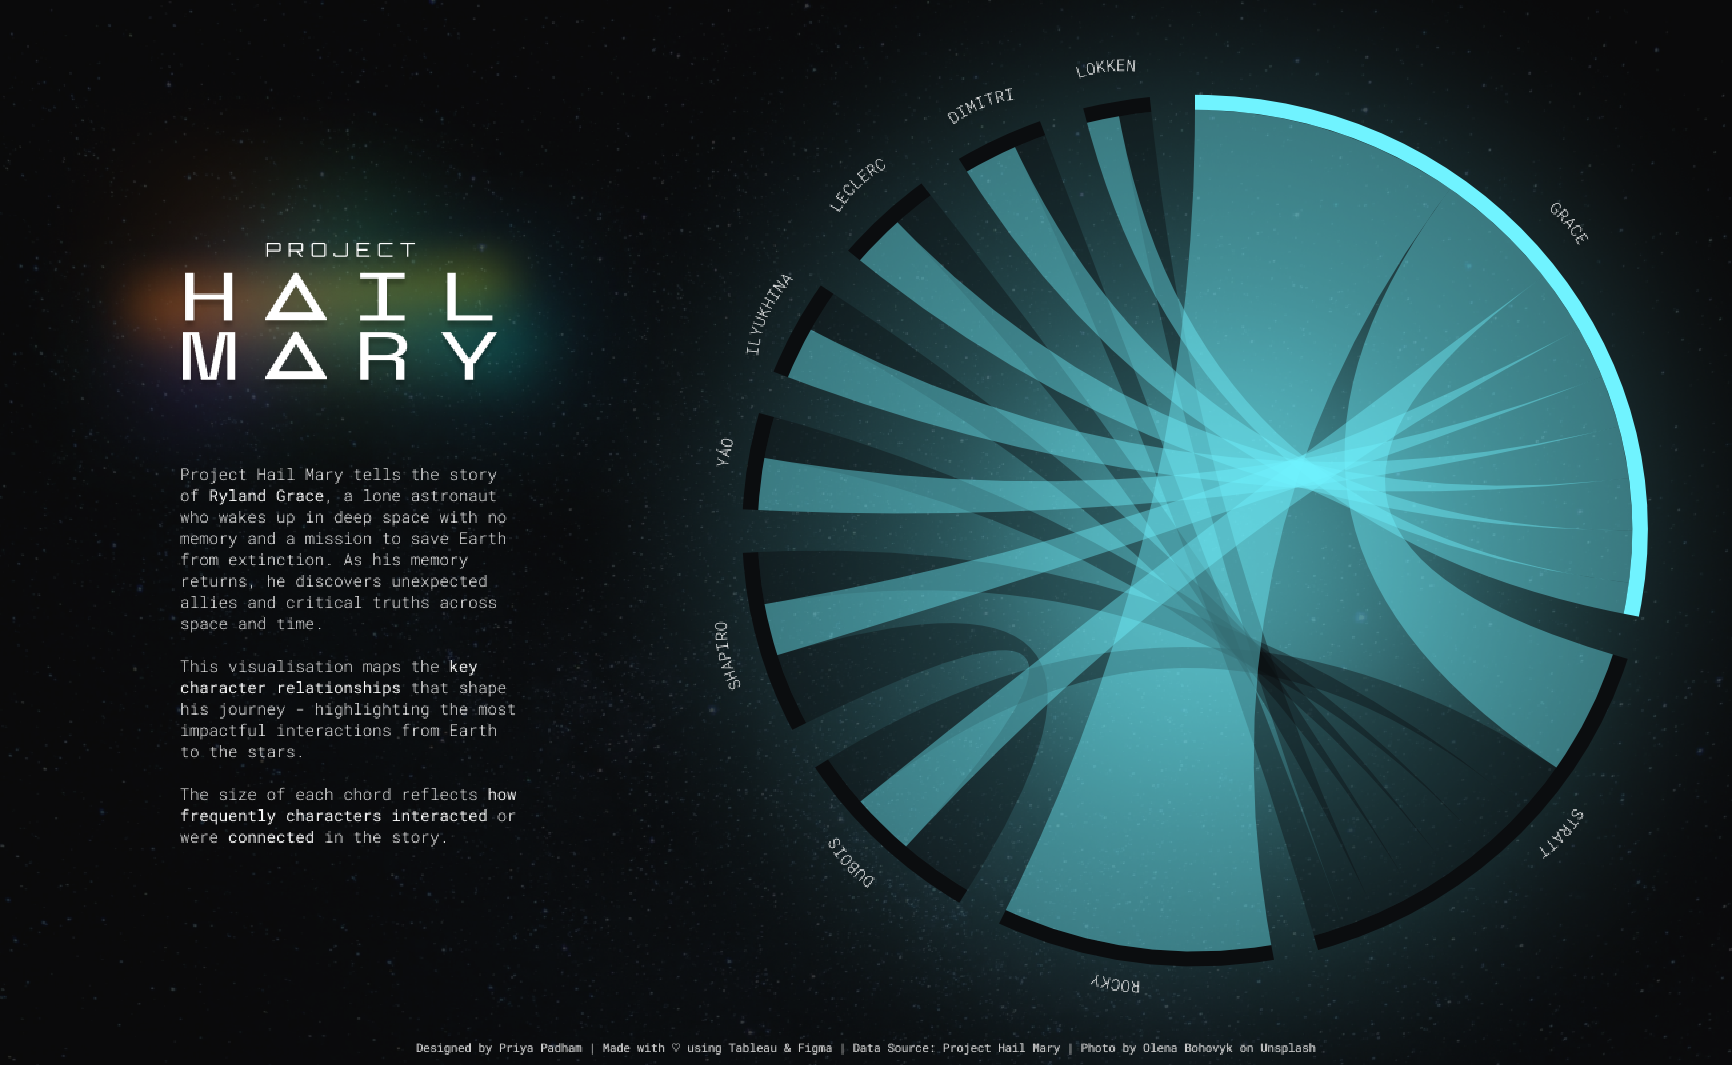
Priya Padham: Project Hail Mary
See the latest Viz of the Day, trending vizzes, featured authors, and more on Tableau Public.
Check out some inspirational vizzes created by the community:
- Aakarsh R: ICC Champions
- Ananya D: Minds for Care- Global Concern for Mental Health #B2VB-Week 20
- Anna Clara Gatti: 25 years of baby names in Italy
- Dmitry Shirikov: Harry Potter’s Hogsmeade Superstore
- Ilija stojić: NASA Climate Spiral
- John Johansson: Bar Design Guide
- Jordan Bullington-Miller: Women of Disney, Part I: The Imagineers
- Miles Crow: 3 Visitors from the Stars
- Naresh Suglani: The Most Dominant F1 Cards in History #F1
- Oluwadunsin A: Global Prosperity and Longevity Report
- Valerie Madojemu: Shopify Overview (RAW Nutrition Concept)
- Vignesh Suresh: Global Corruption Perception Index
Community Projects
Back 2 Viz Basics
A bi-weekly project helping those who are newer in the community and just starting out with Tableau. Not limited just to newbies!
Web: Back 2 Viz Basics
X: #B2VB
Workout Wednesday
Build your skills with a weekly challenge to re-create an interactive data visualization.
Web: Workout Wednesday
X: #WOW2022
Preppin' Data
A weekly challenge to help you learn to prepare data and use Tableau Prep.
Web: Preppin’ Data
X: #PreppinData
Makeover Monday
Create business dashboards using provided data sets for various industries and departments.
Web: Makeover Monday
X: #MakeoverMonday
Data ChangeMakers
Volunteer to design data visualizations that help nonprofits harness the power of data for social change.
Web: Data ChangeMakers
Visual Climate
Collaborate and share climate data.
Web: Visual Climate
X: #VisualClimate
DataFam Con
A monthly challenge covering pop culture and fandoms.
Web: DataFam Con
X: #DataFamCon
EduVizzers
A monthly project connecting real education data with real people.
Web: Eduvizzers
Games Night Viz
A monthly project focusing on using data from your favorite games.
Web: Games Nights Viz
X: #GamesNightViz
Iron Quest
Practice data sourcing, preparation, and visualization skills in a themed monthly challenge.
Web: Iron Quest
X: #IronQuest
Storytelling with Data
Practice data visualization and storytelling skills by participating in monthly challenges and exercises.
Web: Storytelling with Data
X: #SWDChallenge
Project Health Viz
Uncover new stories by visualizing healthcare data sets provided each month.
Web: Project Health Viz
X: #ProjectHealthViz
Diversity in Data
An initiative centered around diversity, equity & awareness by visualizing provided datasets each month.
Web: Diversity in Data
X: #DiversityinData
Sports Viz Sunday
Create and share data visualizations using rich, sports-themed data sets in a monthly challenge.
Web: Sports Viz Sunday
X: #SportsVizSunday
Real World Fake Data
Create business dashboards using provided data sets for various industries and departments.
Web: Real World Fake Data
X: #RWFD
Data Plus Music
A monthly project visualizing the data behind the music we love!
Web: Data Plus Music
X: #DataPlusMusic
BizViz52
A weekly project centered around designing business dashboards.
Web: BizViz52
X: #BizViz52
Zugehörige Storys

DataFam Roundup June 2026

DataFam Roundup May 2026

Iron Viz 2026: Read Between the Data
 28 Mai, 2026