DataFam Roundup: February 5–9, 2024


Welcome! Dig into this week's DataFam Roundup—a weekly blog that brings together community content all in one post. As always, we invite you to send us your content—and the DataFam content from your peers that have inspired you! Find the content submission form here.
Community Highlight
To recognize new and consistent Tableau contributors—we’re excited to have a section within the weekly DataFam Roundup called the Tableau Community Highlight. Find out how to get involved.

Edmund Neil, Business Intelligence Developer
New Brunswick, Canada
Edmund Neil is a Business Intelligence Developer who stays active in the Tableau Community by participating in community projects, contributing to the Costa Rica Tableau User Group, and publishing visualizations on Tableau Public. Edmund also hosts Tableau workshops to engage more closely with individuals eager to learn about data visualization and analysis.
Through his search for Spanish tutorial content, Edmund found the CommuniDatos Tableau User Group. After connecting with one of the group leaders, Edmund received an invitation to present at one of the CommuniDatos User Group meetings which was the start of his active involvement in the group. Since then, Edmund has contributed to the formation of other Latino groups in various countries within the region.
On Tableau Public, Edmund frequently publishes visualizations about soccer. He gets inspiration from other Tableau content and works to apply techniques and ideas to the data that interests him.
Connect with Edmund on Linkedin, X, and Tableau Public.
DataFam content
Dive into content created by the Tableau Community:
-
Randy Bean, The Data Leadership Collaborative: 2024 Leadership and AI Survey Analysis: What Data Leaders Need to Know
-
Louis Yu: GNV Live Builds | 10 Most Powerful Marvel Superheroes
-
Zach Bowders: The Man with the Getaway Face
-
Ken Flerlage, The Flerlage Twins: Synchronize Your Tableau Filter Actions and Quick Filters
-
Ivett Kovács: #BigLittleTips -Practical Tableau Tips_04
-
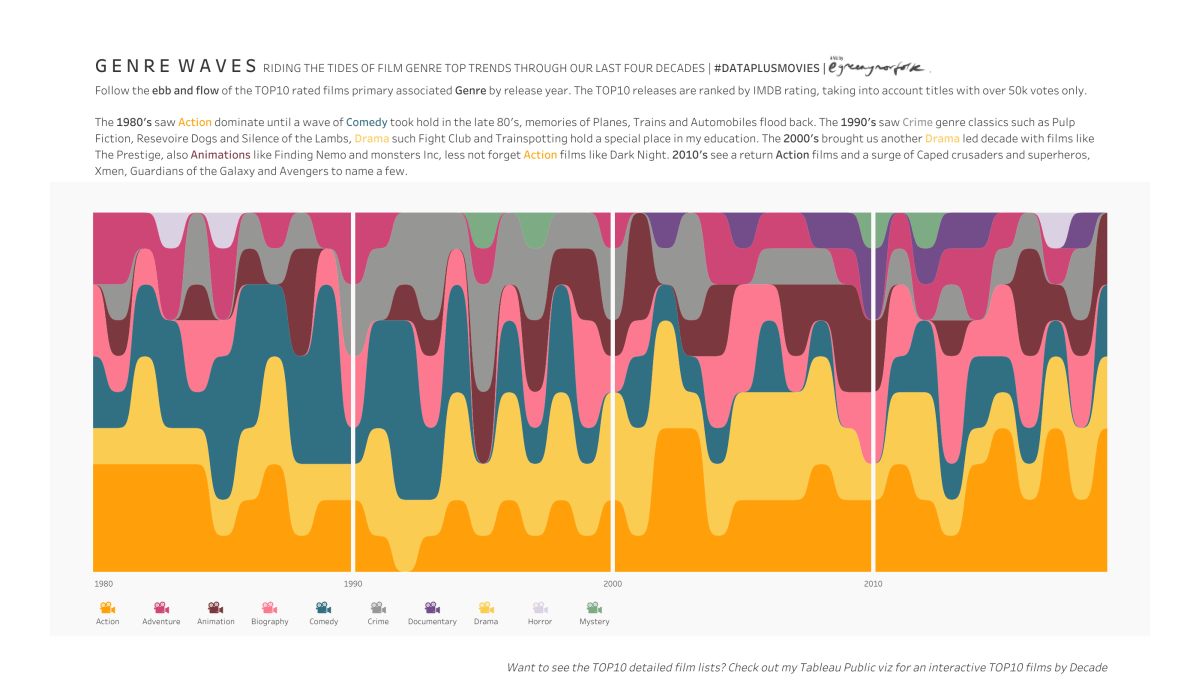
Adam Green: Coffee Table Viz: Genre waves
-
Rajeev Pandey, Viz Art Pandey: CREATE TILED MAP IN TABLEAU IN JUST 2 MINUTES
-
Darpan Bajaj: How To Split Columns In Tableau
-
Tableau Vibes with Jatin: Tableau Fundamentals: Diving into Data Types - Part 1
-
Robert Janezic: Tableau Templates
-
Real time with T&M: MY DATA ANALYSIS JOURNEY- ROAD TO BE A TABLEAU DEVELOPER - IDRIS’ SESSION
-
Deepak Holla:
-
Action Analytics: Mental Models
-
Tristan Guillevin, Uncharted Area: Viz Extensions - Tableau's Biggest Revolution
-
Michael Sandberg's Data Visualization Blog: Tableau Community Spotlight: Revisiting Aurélien Vautier and His New Dataviz Clarity Web Site
Team Tableau
-
Practice and Grow Your Data Skills with Tableau Community Projects
- Transforming Ideas into Features: Tableau's Commitment to Community-Driven Innovation
- How Victor Muñoz Landed a Data Visualization Gig Using Hire Me
Upcoming events and community participation
-
Lights, Camera, Action: Tableau and IMDb Launch Data Visualization Campaign for Movie Lovers
-
READY TO SUPERCHARGE YOUR DATA SKILLS? The Information Lab has free, on demand training courses will help you to make sense of your data and take you from zero to data hero. Developed by our industry leading trainers, our expansive courses cover the basics to intermediate levels of Tableau, Alteryx and Tableau Prep! You can take advantage of the whole course or simply choose the modules you need to brush up on your skills. Start your data journey today by simply selecting your training course below.
-
Demystifying the way to learn Data Visualization! Are you looking for a way to learn Data Visualization and feeling lost? We all have been there and I am going to help you understand the fundamentals and look for a way to learn data visualization.
-
Viz Collab: Hello everyone! I’m excited to be opening #VizCollab back up for another round of matches! In the last year I matched around 40 people for some amazing vizzes, including Viz of the Days and a viz that was featured in a local publication. So if you want to find a collaboration partner sign up.
Vizzes
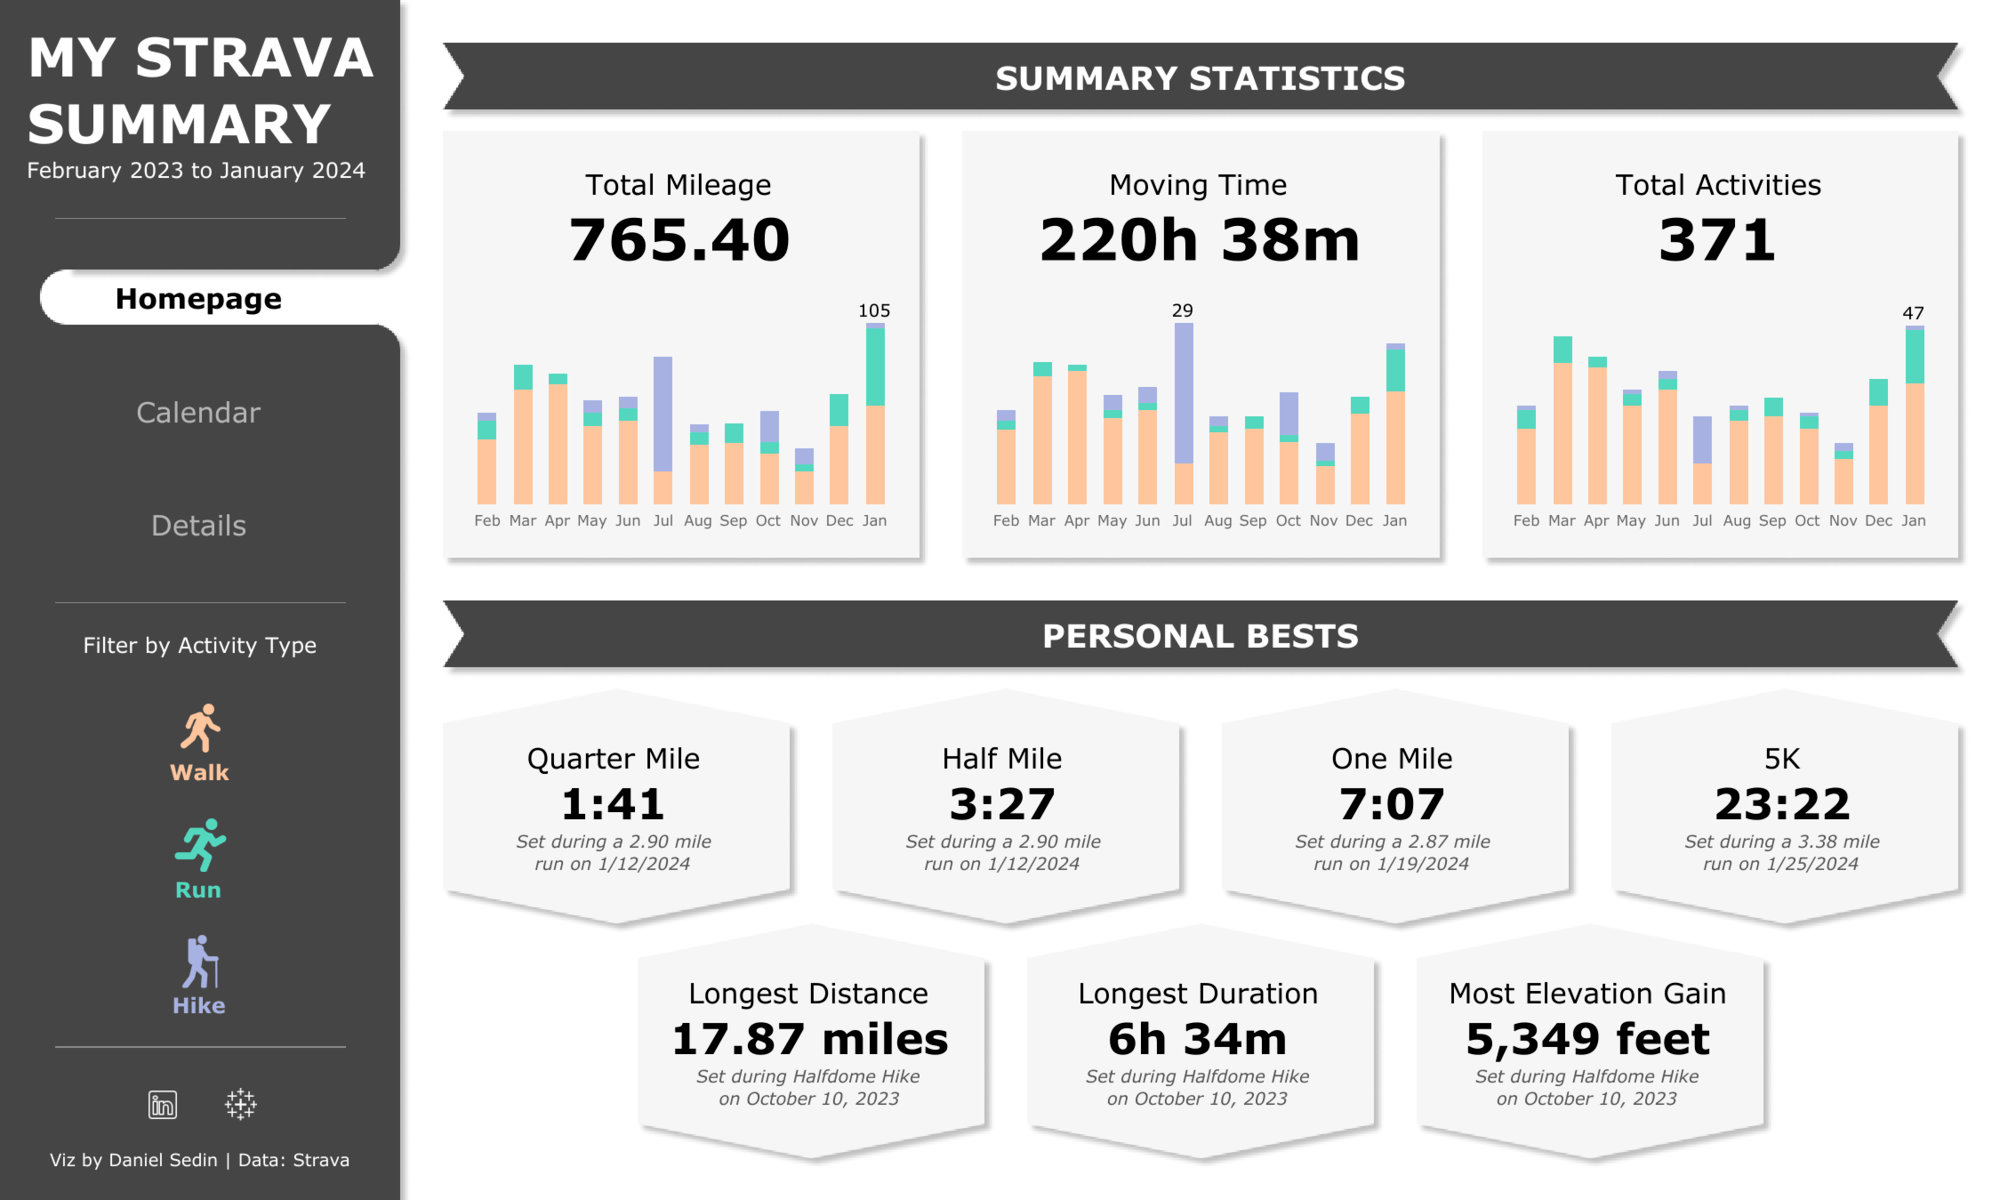
Daniel Sedin: Strava Summary
See the latest Viz of the Day, trending vizzes, featured authors, and more on Tableau Public.
Check out some inspirational vizzes created by the community:
-
Kevin Wee: Nutrition Values of Dim Sum Dishes (lotus-shaped polygons)
-
Zach Bowders: The Man with the Getaway Face
-
Raisa Hannus: #DuBoisChallenge2024 - Re-Visualizing the Black America of W.E.B. DuBois
-
Adedamola (Damola) Ladipo: Total Yearly Cost to Study in Select European Countries
-
Jacob Rothemund: MLB Salary Comparison by Year | #B2VB Week 1
-
Ray Givler: How to Add Variety to KPI Cards
-
Victory Omovrah: #MakeoverMonday - Cost to Study In Europe
-
Waqar Ahmed Shaikh: #MakeOverMonday | 2024_W1 | New Year's Resolution
-
Daniel Sedin: Strava Summary
Community Projects
Recreations of W.E.B Dubois's Data Portraits
Recreations of W.E.B Dubois's Data Portraits
Web: W.E.B. Dubois's Data Portraits
Twitter: #DubiosChallenge
Back 2 Viz Basics
A bi-weekly project helping those who are newer in the community and just starting out with Tableau. Not limited just to newbies!
Web: Back 2 Viz Basics
Twitter: #B2VB
Week 3: Build a Text Table
Workout Wednesday
Build your skills with a weekly challenge to re-create an interactive data visualization.
Web: Workout Wednesday
Twitter: #WOW2022
Week 6: Top & Bottom Variance
Preppin' Data
A weekly challenge to help you learn to prepare data and use Tableau Prep.
Web: Preppin’ Data
Twitter: #PreppinData
Week 5: Staff Income Tax
DataFam Con
A monthly challenge covering pop culture and fandoms.
Web: DataFam Con
Twitter: #DataFamCon
February 2024 Challenge: Unveiling Romance
EduVizzers
A monthly project connecting real education data with real people.
Web: Eduvizzers
February 2024: SPP compared to SPS Kindergarteners | City of Seattle Open Data Portal
Games Night Viz
A monthly project focusing on using data from your favorite games.
Web: Games Nights Viz
Twitter: #GamesNightViz
Season 2: With great power comes great vizzes
Iron Quest
Practice data sourcing, preparation, and visualization skills in a themed monthly challenge.
Web: Iron Quest
Twitter: #IronQuest
White Space
Storytelling with Data
Practice data visualization and storytelling skills by participating in monthly challenges and exercises.
Web: Storytelling with Data
Twitter: #SWDChallenge
January 2024: upskill with UpSets
Project Health Viz
Uncover new stories by visualizing healthcare data sets provided each month.
Web: Project Health Viz
Twitter: #ProjectHealthViz
October 2023: Customizing Shapes with Opacity in Tableau
Diversity in Data
An initiative centered around diversity, equity & awareness by visualizing provided datasets each month.
Web: Diversity in Data
Twitter: #DiversityinData
November 2023: Disney Demographics
Sports Viz Sunday
Create and share data visualizations using rich, sports-themed data sets in a monthly challenge.
Web: Sports Viz Sunday
Twitter: #SportsVizSunday
Viz for Social Good
Volunteer to design data visualizations that help nonprofits harness the power of data for social change.
Web: Viz for Social Good
Twitter: #VizforSocialGood
Real World Fake Data
Create business dashboards using provided data sets for various industries and departments.
Web: Real World Fake Data
Twitter: #RWFD
Session 6: HR Cross-Function Mobility
Makeover Monday
Create business dashboards using provided data sets for various industries and departments.
Web: Makeover Monday
Twitter: #MakeoverMonday
Data Plus Music
A monthly project visualizing the data behind the music we love!
Web: Data Plus Music
Twitter: #DataPlusMusic
Zugehörige Storys

DataFam Roundup June 2026

DataFam Roundup May 2026

Iron Viz 2026: Read Between the Data
 28 Mai, 2026