We are excited to announce Tableau Online is now running on Amazon Web Services in the US-East (Virginia) region. Tableau Online is our fastest-growing product with more than 5,000 customer accounts in more than 100 countries. This latest expansion will enable us to scale faster and support our customers in more parts of the world. Our first available data center was on the West Coast, followed in January by the European data center in Dublin. Check out these tips for creating different map styles in TableauAlle Storys

10 business intelligence trends we expect to see in 2017
 12 Dezember, 2016

Tableau 10.2 beta is here
 8 Dezember, 2016

Follow these made-in-Tableau holiday calendars
 7 Dezember, 2016
Why scribbling is the key to truly understanding your data
 6 Dezember, 2016


The state of data education in 2016
 5 Dezember, 2016

Big news and big data at AWS re:Invent
 2 Dezember, 2016


TC recap, network chart among best of the Tableau web
 1 Dezember, 2016

Tableau Online now available on AWS
29 November, 2016
Visualisierungsübersicht: Songs, Zaubersprüche und Wahlmännerstimmen
 28 November, 2016

10 Tips for Creating Different Map Styles in Tableau
 23 November, 2016
Enterprise
Over the last few years, we’ve watched data transform organizations of all types and sizes. Companies that began harnessing the power of their data gained a competitive edge and were able to innovate faster.
What's in store for next year? Here are 10 trend we expect to see in 2017.
Product
Got the winter blues? We’ve got a cure in the form of Tableau 10.2 beta!
Tableau 10.2 comes with a host of new features for data rockstars and IT champions alike. Our new features for data prep and analysis are designed to help you do more with your data. And our accessibility features and added web-authoring power will help enterprises scale. Here's a sneak peek at some of the hottest features.
Visualizations
Happy holidays! 'Tis the season to be jolly. To help you all get into the festive mood, we'd like to share three Tableau-made holiday calendars.
Visualizations
Scribbling is especially valuable when it comes to data analysis. Simply put, the goal of analyzing data is to find insights and communicate them in an optimal, engaging way. But you don’t reach this goal by first deciding which chart types you want and then adding the data. Saying something like “I will start with a bar chart” and adding data to it is the equivalent of trying to create a masterpiece with a paint-by-numbers set.

Data Skills
As a company invested in increasing data literacy in the world, we decided to look at how our higher-education system is preparing students to work with data. The Tableau team researched how more than 7,000 American universities are approaching analytics education. The result is our new report, “The State of Data Education in 2016.”
Tableau Cloud
Today is the last day of AWS re:Invent, and it marks the end of an exciting week full of learning and new technology.
Tableau Community
Relive the magic that was TC16. And check out the best of the Tableau web.
Tableau Cloud
Visualizations
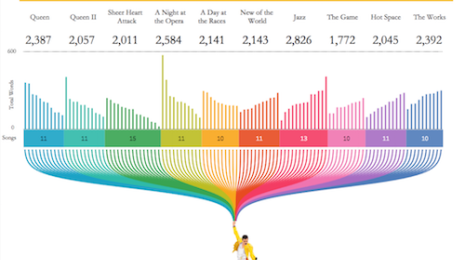
Von den US-Präsidentschaftswahlen über die Zaubersprüche von Harry Potter bis zu den Lebensumständen von Taxifahrern haben Sie, unsere einzigartige Community, in den vergangenen Monaten viele herausragende Visualisierungen zu einer Vielzahl von Themen erstellt. Hier finden Sie fünf außergewöhnliche Beispiele aus unserem Viz des Tages-Feed.
Tips & Techniques