It’s essential for the next generation workforce and business leaders to know how to understand data. The aim of the Academic Programs here at Tableau is to empower students with these valuable skills.Alle Storys
![]()
And the winner of the #DataDev hackathon is...
 25 August, 2017
![]()
10 Möglichkeiten zur Visualisierung von Geodaten in Ihren Dashboards
 24 August, 2017
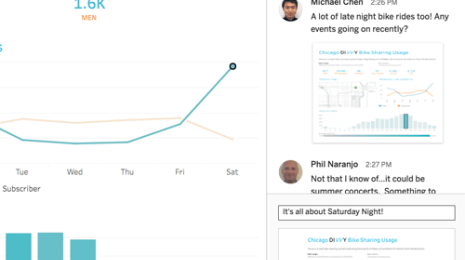
Join the discussion with these powerful collaboration features
 22 August, 2017

May I have the envelope please? The Winner of Iron Viz Silver Screen is...
 21 August, 2017
![]()
Total eclipse of the data
 18 August, 2017

![]()
How Ballard High School used Tableau to win a global robotics competition
 14 August, 2017
![]()
Back to school: New Data Visualization Curriculum for students

Welcome to Tableau, ClearGraph team!
 9 August, 2017

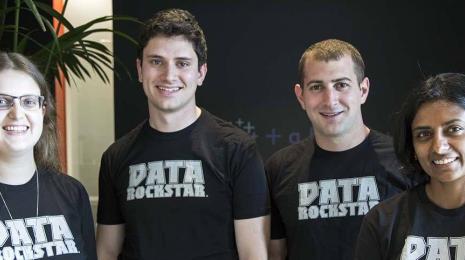
Generation Data: Tableau skills help Northeastern student land Alaska Airlines internship
 8 August, 2017
