Hier werden 10 aussagekräftige Beispiele für Tabellenberechnungen von Tableau präsentiert. Die meisten erfordern das Schreiben einer einfachen Formel. Jedes Beispiel enthält ein Live-Beispiel und Anweisungen in einer Ansicht mit Registerkarten. Sie können alle Arbeitsmappen auch herunterladen, wenn Sie sich ausführlicher informieren möchten. Andy Cotgreave shares the highlights from Iron Viz at Tableau Conference 2019. To make tables even more powerful and flexible, we’ve added support for up to 50 columns with horizontal scrolling, and a more intuitive sorting experience. Im vergangenen Jahr haben wir neue Optionen für den erweiterten Support und den Premiumsupport eingeführt, die in erster Linie für Kunden gedacht sind, die ihre eigene Tableau Server-Umgebung vor Ort verwalten. Um den Bedürfnissen von mehr Kunden gerecht zu werden, die von lokalen zu Online-Lösungen und -Dienstleistungen wechseln, haben wir unsere Supportangebote erneut aktualisiert. Wir freuen uns, den neuen erweiterten und Premiumsupport für Tableau Online-Kunden vorzustellen.Alle Storys

Fraud risk expert assesses data climate in government offices
 2 Dezember, 2019

DataFam meets Trailblazers: The power of data at Dreamforce 2019
 24 November, 2019

Die 10 wichtigsten Tabellenberechnungen in Tableau
 22 November, 2019
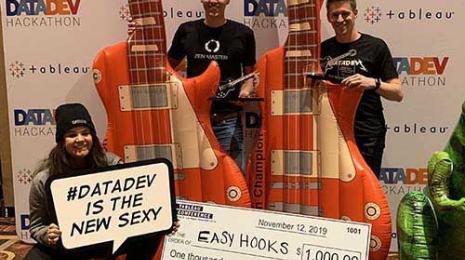
#Data19 DataDevs hack their way to rockstar status
 20 November, 2019

Fraud risk expert assesses data climate in government offices
18 November, 2019

Iron Viz 2019 sliced and diced food data to a flavorful finish
 17 November, 2019
Devs on Stage dazzles: Dynamic Parameters, Noodles, and Animation are simply the best
 14 November, 2019

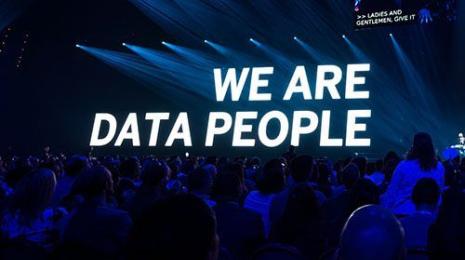
Empowering a Data Culture to drive change at Tableau Conference 2019
 13 November, 2019

Get a taste of Iron Viz at Tableau Conference 2019
 12 November, 2019
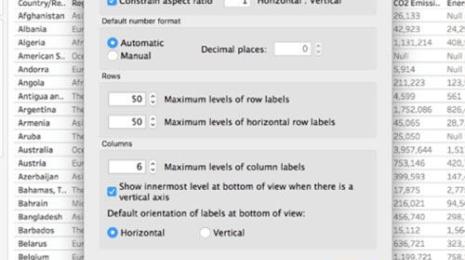
Dive into details with improved table visualizations
 8 November, 2019

Für Tableau Online-Kunden sind jetzt erweiterter Support und Premiumsupport erhältlich

Data
This is part two of a two-part conversation with Linda Miller, a principal at Grant Thornton, where she leads the Fraud Risk Mitigation and Analytics Practice.
Tableau
Check out the highlights from Dreamforce 2019.
Tips & Techniques
Developer
This year marked the fifth year of the #DataDev hackathon, and participants brought their A-game. From creative extensions, to using the Hyper API, to bringing CSVS into Tableau, to dynamic filters, our DataDevs used their coding skills and creativity to battle it out for our annual code championship.
Data
This is part one of a two-part conversation with Linda Miller, a principal at Grant Thornton, where she leads the Fraud Risk Mitigation and Analytics Practice.
Iron Viz
Developer
Catch up on what you missed this #data19! Dive into what is coming to Tableau from Devs On Stage—everything from animations to Tableau Server tools to dynamic data, and more.
Tableau
This morning in Las Vegas we kicked off our 12th annual Tableau Conference—our biggest yet, with data rockstars from all over the world! Read on for Adriana Gil Miner's recap of Opening Keynote highlights.
Tableau Community
Get to know a little more about Iron Viz– everything from this year's contestants to how the judging works.
Product
Tableau
7 November, 2019
