In this look back at the last two months of blogs, Andy Cotgreave shares his round-up of the Best of the Tableau Web, including posts that review Tableau Conference 2019, blogs from two Iron Viz contestants about the experience, reflections on the what the Tableau Community means to dozens of members, and more. He also says farewell to Kelly Martin, beloved community member and member of the Tableau Zen Masters Hall of Fame. Tableau Visionary Ryan Sleeper shares his tips for creating mobile-first dashboards in Tableau, including how to: determine if you should consider a mobile-first design, scroll multiple sheets at once and eliminate default scroll bars completely, leverage tooltips, and more.Alle Storys

Nominations are open for 2020 Zen Masters!
 20 Dezember, 2019
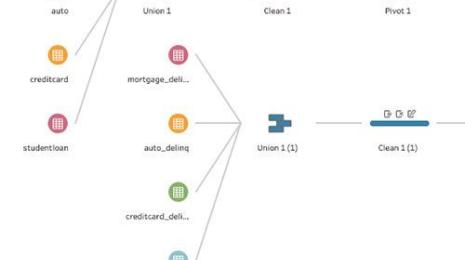
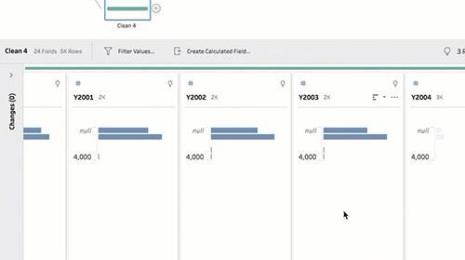
How to reuse flows in Tableau Prep Builder for repeatable cleaning tasks
 18 Dezember, 2019

Georgia Tech expands internal audit success with data visualization
 16 Dezember, 2019

Drei Schritte zur Förderung einer starken Datenkultur
Jetzt in der Betaversion: Animation von Visualisierungen, dynamische Parameter und Umkreisberechnungen für Karten
 11 Dezember, 2019
USAA manages financial risks with Tableau and improves enterprise compliance
 11 Dezember, 2019
Neu in Tableau Prep Builder: Einfacheres Pivotieren, eine Fortschrittsanzeige und neue Connectors
 10 Dezember, 2019


Introducing learning paths: Sharpen your skills with new role-based learning
 9 Dezember, 2019

Best of the Tableau Web: A look back at TC, the Community, and a fond farewell
 6 Dezember, 2019

How to build a sales effectiveness program for LinkedIn Sales Navigator with Tableau
 4 Dezember, 2019

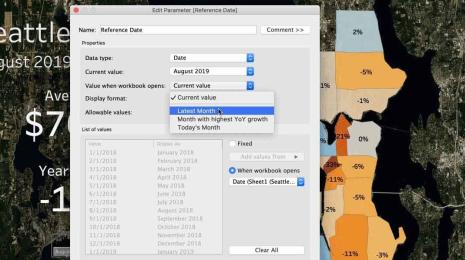
5 tips for mobile-first dashboard design in Tableau
 3 Dezember, 2019
Tableau Community
Nominations for Zen Masters are open! We want to hear from you, we invite you to share with us stories of people who inspire and guide you.
Data
Check out how you can reuse flows in Tableau Prep Builder to help clean up multiple data sets that have similar patterns—saving you repetitive and unnecessary work.
Data
Using software from Tableau the Georgia Tech has improved the way they respond to allegations of fraud and abuse through a data-driven approach. In the following interview, Georgia Tech’s Chief Audit Executive, Phil Hurd, explains more about the program.
Data
12 Dezember, 2019
Moderne Unternehmen kultivieren das, was heute als „Datenkultur“ bezeichnet wird. Eine solche Datenkultur setzt bei internen Communitys und Benutzergruppen an, die durch gemeinsame Ziele und Praktiken verbunden sind und miteinander im sozialen Austausch stehen. Wir möchten Ihnen zeigen, wie Sie diese Communitys in Ihrem Unternehmen unterstützen können.
Product
Die Betaversion von Tableau 2020.1 ist da – mit spannenden neuen Funktionen zur Dateninteraktion. Das sind die Highlights der neuen Version.
Data
As your organization struggles to see and understand business risks, the risks become more threatening, and employees and customers grow nervous about their impact. These latent risks impact many businesses, and Alfred Mathena explains why USAA is no exception.
Product
Im Dezember-Release von Tableau Prep Builder (2019.4.2) haben wir das Umformatieren von Daten vereinfacht und das Benutzererlebnis beim Vorbereiten der Daten verbessert.
Data Skills
We launched role-based learning as part of Tableau eLearning. Consisting of 12 specialized learning paths aligned to Tableau roles across the organization, each role is designed to accelerate the proficiency of your people quickly and effectively.
Best of Tableau Web
Enterprise
With the 2019.4 release, Tableau released a LinkedIn Sales Navigator connector and dashboard starters to improve the productivity and performance of sales organizations. We dive into dashboards that can quickly provide current reporting and analysis, reveal actionable insights into sales activity, and optimize sales performance with this social selling platform. Learn how you can develop a sales effectiveness program with LinkedIn Sales Navigator and Tableau, beginning with the following four dashboards.
Tips & Techniques