Alle Storys
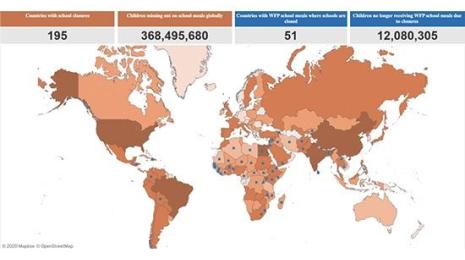
COVID-19 is closing schools, but the World Food Programme is using data to make sure kids still get meals
 15 April, 2020
Update to our COVID-19 response
 14 April, 2020

How to slow the spread of misinformation
 13 April, 2020
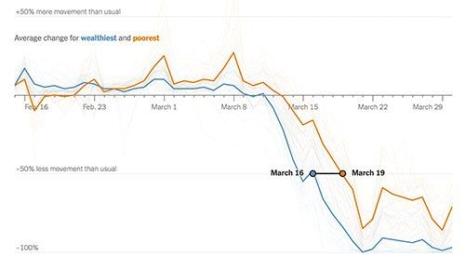
Thirteen things to visualize about COVID-19 besides case loads
 10 April, 2020
Helping you have a fast Tableau experience

How visualizing quantified self data can help you find meaning in a quarantined world
 9 April, 2020
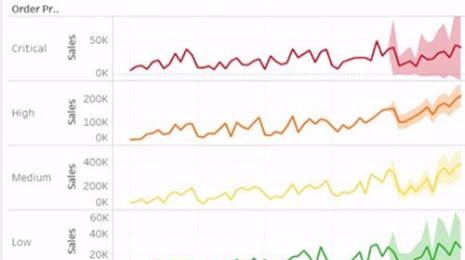
If Data Could Talk: Color legends, data uncertainty, and forecasting pitfalls
 9 April, 2020
A conversation with an Epidemiologist: 5 things to keep in mind when you look at the numbers on COVID-19
 8 April, 2020
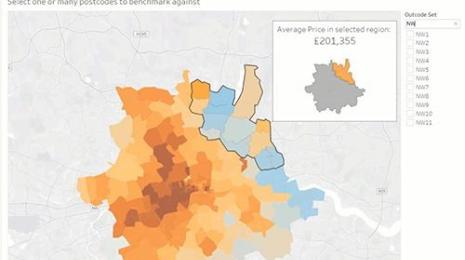
Powerful analytics in a user-friendly package with the set control
 8 April, 2020
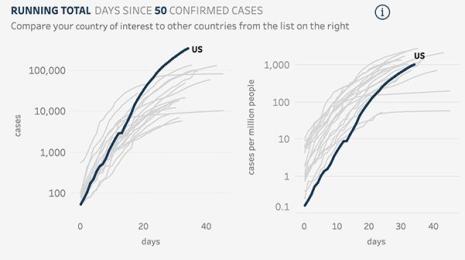
You are (almost definitely) not qualified to make predictions about COVID-19. We’re here to help explain why.
 6 April, 2020
Wie Behörden die Öffentlichkeit mithilfe von Tableau auf den neuesten Stand beim Coronavirus bringen
3 April, 2020
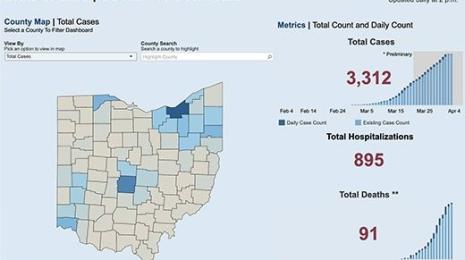
Visualizing coronavirus data? Consider adding a disclaimer
3 April, 2020
COVID-19
COVID-19 has upended communities and individuals’ lives across the world. While the focus is now on flattening the curve of the disease and keeping people healthy, it’s also important to understand the many other impacts of the virus. For the World Food Programme (WFP), the food-assistance branch of the United Nations and the world’s largest hunger-relief agency, program leaders immediately knew that the pandemic would pose a challenge to their programs—specifically, to schoolchildren’s access to food.
COVID-19
we have developed hands-on solutions for each of these areas. We know many of you may have similar needs; I hope you’ll check out the online resources highlighted below or contact our amazing team. We’re here to help.
COVID-19
Fifteen questions to help you gauge the trustworthiness of COVID-19 stats.
COVID-19
Members of the Data Visualization Society joined forces earlier this week to catalog what else related to COVID-19 would be worthwhile for researchers and policymakers worldwide to measure related to COVID-19.
Product
10 April, 2020
To ensure you have a fast analytical experience, we’re making an update to our minimum hardware requirements.
Tableau Public
Data Skills
Welcome back to another recap of our livestream series, If Data Could Talk! Each episode, data experts from the community share resources you can read, watch, or listen to around the topic of data literacy. This episode features co-hosts Andy Cotgreave and Amanda Makulec, along with special guest Sarah Wachter, Product Manager of Augmented Analytics at Tableau.
COVID-19
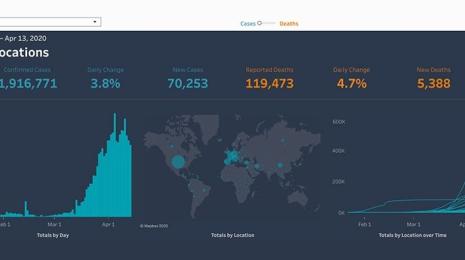
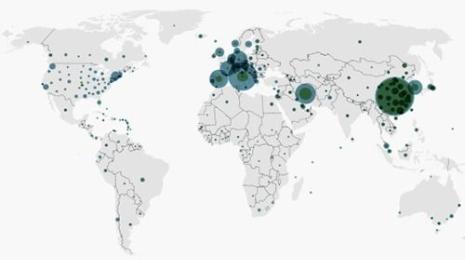
The world is watching as new cases of COVID-19 emerge daily. We look to data for answers: We want to see the latest numbers, know how quickly case counts are increasing, and make sense of what feels like an uncertain future.
Product
Tableau 2020.2 introduces set control, a new way to interact with data and alter set membership with familiar, filter-like functionality.
COVID-19
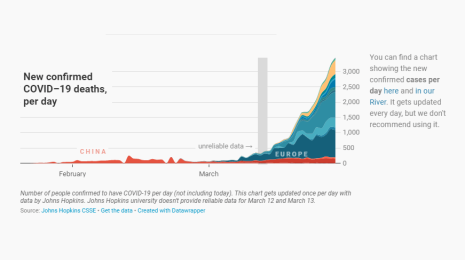
If you’ve been exploring data about COVID19, you might be tempted to use the forecasting feature in Tableau to look at the trajectory of COVID-19 cases and deaths. But if you do, should you publish what you find?
COVID-19
Da sich das Coronavirus in den Ländern weltweit weiter ausbreitet, sind die Menschen überall auf vertrauenswürdige Informationen angewiesen. Die Verantwortlichen in den Behörden sind deshalb bestrebt, den Menschen solche Informationen so schnell wie möglich zur Verfügung zu stellen. Gleichzeitig führen sie eigene interne Datenanalysen durch, um die erforderlichen Maßnahmen und Strategien als Antwort auf die Pandemie zu ermitteln und entsprechend zu gestalten.
COVID-19
When you hear the word disclaimer, what comes to mind? The word sounds like legalese to many, or something you find on WebMD reminding readers that the site is meant to share information but does not give medical advice.