How to use Tableau for financial planning to drive deeper business impact


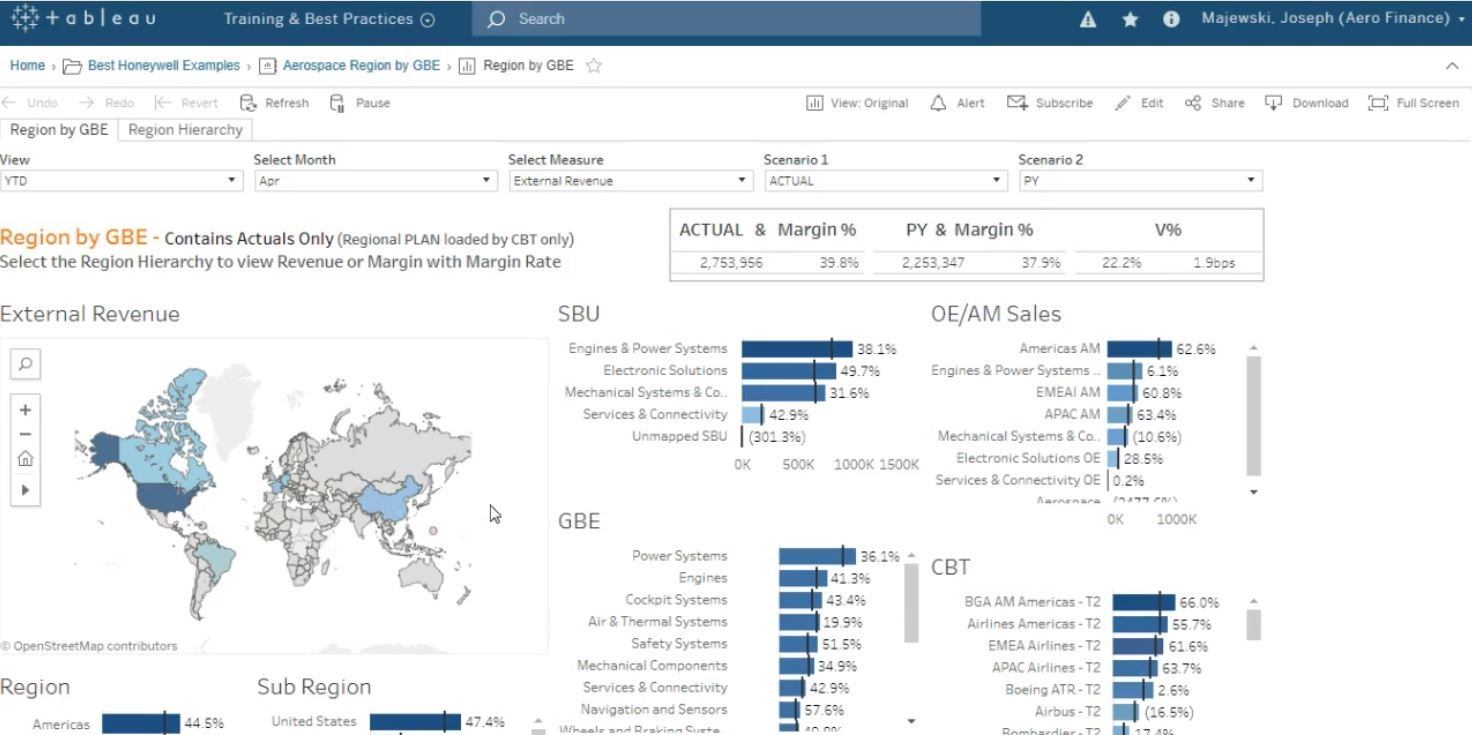
Image above does not depict real-world data
Editor's note: Honeywell is a Fortune 100 and American multinational conglomerate that produces commercial and consumer products, engineering services and aerospace systems for diverse customers. They've used Tableau for more than two years to drive insightful analytics and a self-service reporting culture across the business. With partnership and Tableau adoption by finance, they’re experiencing greater productivity, seeing stronger financial performance with visibility into areas like inventory management, and reporting time has significantly reduced. We invited Senior Finance Director Joseph Majewski to share perspective about how Honeywell uses Tableau for stronger financial planning.
Many professionals can relate to the scenario of business partners relying heavily on Finance to review data and produce quick answers (and sometimes with undesirable deadlines). Honeywell is no different. In fact, our CFO’s tell Finance employees, “You didn't go to school and become Finance professionals to develop manual, repetitive reports in Excel. And we don’t want you to. Instead, we want you to be focused on being better business partners, driving impactful analytics.” So, our adoption of Tableau has been key for me and others in Finance to stop the Excel gymnastics and capture, analyze and understand large amounts of data as we forge a stronger partnership with the business.
There have been several “pilot” projects across our business groups utilizing Tableau to enhance the reporting and analytics experience for better outcomes and efficiencies. With support from our Honeywell CFOs, and even business Presidents, there have been numerous success stories the last two years. One such story was a pilot program that supported an inventory challenge where nearly $10 million in revenue was realized through data analysis tied to stranded inventory. The pilot and its success led to broader adoption by the Performance Materials and Technologies teams.
To take a closer look at the adoption process, our Honeywell team went through a phased approach. We started with the introduction of new data and visualization for self-service, which gave the inventory team a chance to access and review data with new understanding. The project evolved by adding demand data to create action-oriented views and to support consumption by a wider audience in five different recurring meetings. Other critical elements used in the inventory project and leveraged in our Business Intelligence projects are:
- Projects should introduce new information or have the potential of demonstrating a significant amount of productivity.
- Analytics must be actionable…don’t just tell the what or why, but provide insights that help leaders make decisions and act.
- Iteration is key. We aren’t afraid to start small and we gather feedback that supports adoption.
Under the leadership of our CFO, we’ve also created enterprise-wide, standard finance reports that mitigate Excel activity and foster self-service reporting. The reports provide standard summaries and key metrics that show performance at the end of each reporting period.
With growing momentum, and over 25,000 users on Tableau Server, Honeywell Finance is continuously enhancing our position of being better business partners; driving insightful analytics daily that help the business groups make important, strategic decisions. Taking an analogy from the construction industry, my approach to business intelligence considers our Finance Systems teams as “framers.” We make data connections, acting as a liaison between finance and IT. Then functional finance, who are the subject matter experts, act as “finishers.” They handle the data and develop impactful analytics, the best of which become products put into standard use.
Here are some lessons we’ve learned along the way and could benefit your FP&A function:
Working with data can be complicated, but it doesn’t need to be, if you follow these measures.
- Assess what you’re already doing. Can you use your current tools to create a data source before you initiate an IT project?
- Engage passionate people as change agents. We’ve had folks in Finance learn custom SQL in Tableau to improve the performance of workbooks and enhance the delivered product.
- And work together…integrating business and IT resources is critical. Many have stretched outside their comfort zones digging into analytics, and when they need help, they find IT staff willing to help.
Create a data strategy and leverage governed data. Some helpful considerations we’ve uncovered at Honeywell:
- In Aerospace Finance, we start with our existing HANA views. And we leverage extracts to prototype and pilot solutions before seeking IT development.
- Tableau's role-level security helps us create dimensional filters that mirror our data warehouse security roles, giving us the flexibility to work with extracts on server and ensure data security.
- But we make it a point to go full circle, working with IT to modify or create new HANA views that meet our data and performance needs.
In the end, it’s the people who make the difference with analytics traction.
- Ask leaders to support promotion and help drive adoption in your organization. If you aren’t getting that support, then keep looking until you find the right leader.
- People matter! Personally, I look for the people who always want to improve a process, learn, and are self-starters that try things.
- But don’t wait for others to get on board. Start small, then engage others, and collect feedback to iterate with your business partners.
Want to learn more? Listen to this webinar to hear how Honeywell is driving flexible, self-service finance analytics across the business with Tableau.
相關文章

How Team USA uses data to build a digital HQ
 2022/02/08


Healthcare Analytics Hub Starter Kit: Get the data you need faster
 2019/10/18
The purpose of the Healthcare Analytics Hub Starter Kit is to provide a sample of what your healthcare app could look like. It’s not a complete solution; instead, it’s focused on what’s possible. Please contact your Tableau Account Manager to get started today!
Subscribe to our blog
在收件匣中收到最新的 Tableau 消息。