
Scaled up telehealth operations by 55x in two months during the pandemic
Achieved approximately 5-10 years of digital transformation in two months
Applied predictive models to optimize patient scheduling, and ICU bed capacity
Academic medical center University of Utah (U of U) Health, based in Salt Lake City, has five hospitals and twelve clinics serving communities across a six-state Mountain West region of the US, along with a thriving education and research practice. Like many health systems, it faced daunting operational and economic challenges during the COVID-19 pandemic. The unpredictable rates and patterns of infection made it hard to plan for ICU and hospital bed capacity, while the shutdown of many on-site clinical services threatened to cause significant revenue loss.
Faced with these challenges, U of U Health proactively pursued strategies driven by data visualization technology, and predictive analytics to find ways of providing the best care and patient outcomes while remaining solvent as a business. This effort amounted to a giant acceleration of the health system's digital transformation.
“We really did about 5-10 years' worth of advancement in just a couple of months,” said Charlton Park, Chief Financial Officer and Chief Analytics Officer at University of Utah Health. “Like so many other clinics and institutions, the pandemic hit us hard, and there wasn't time to build a whole new practice from scratch—we had to ramp up using the infrastructure we already had.”
In the case of replacing revenue and care opportunities potentially lost due to the shutdown, that meant taking U of U Health's nascent telehealth program from 800 or so monthly remote visits—mostly urgent care sessions at the community clinics and pre-op/follow-up consulting for some specialty care—to more than 11,000 telehealth visits per week across all locations at the pandemic's peak. Since reopening some services for in-person care, U of U Health has seen its telehealth model continue to thrive. “Our clinicians and patients have truly embraced this remote method of interaction,” said Park. “Even today, our telehealth workload is around 5,000-6,000 visits weekly, and we expect it to stay at the level going forward.”
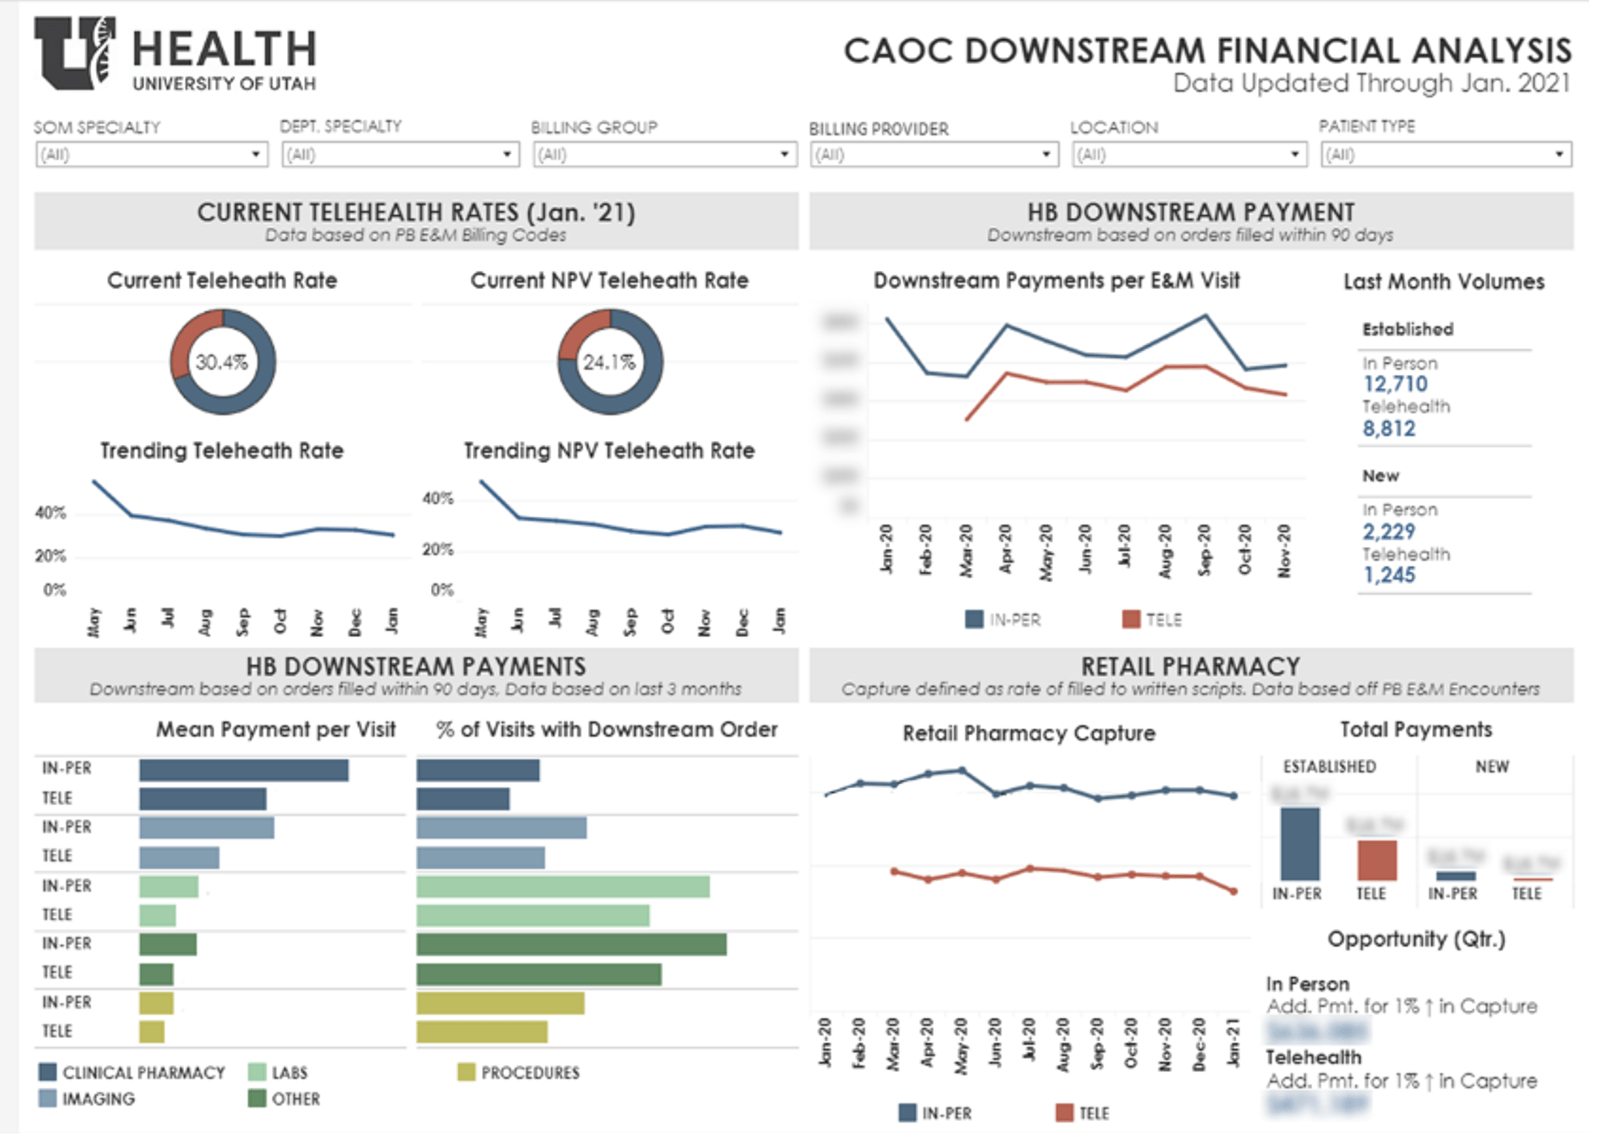
Note: The data in the above image is from January 2021.
Analytics and Tableau visualizations played a big part in making this rapid ramp-up possible. Using data, U of U Health tracked the adoption of telehealth services across its practices and locations, identifying the specialties where it was most effective and allocating resources accordingly. At the same time, they tracked patient experience using survey feedback data and other outcomes to readily see where patients got the most benefit from telehealth and where their experience needed improvement. This represented a new learning curve for the organization during an already difficult time, and up-to-the-minute visualizations driven by relevant data were essential for keeping pace.
Continuity of care during the pandemic was also the focus of other critical U of U Health initiatives involving visual analytics. Bed space was a high priority for COVID-19 patients, particularly in ICUs, but some of that space was also needed for other patients, such as those recovering from surgical procedures. To balance this capacity, they drew on a diverse set of data sources, including risk adjustment data, patient demographics, comorbidity statistics, and American Society of Anesthesiologists (ASA) scores, to build probabilistic models showing likelihood of ICU dependency in non-COVID-19 cases.
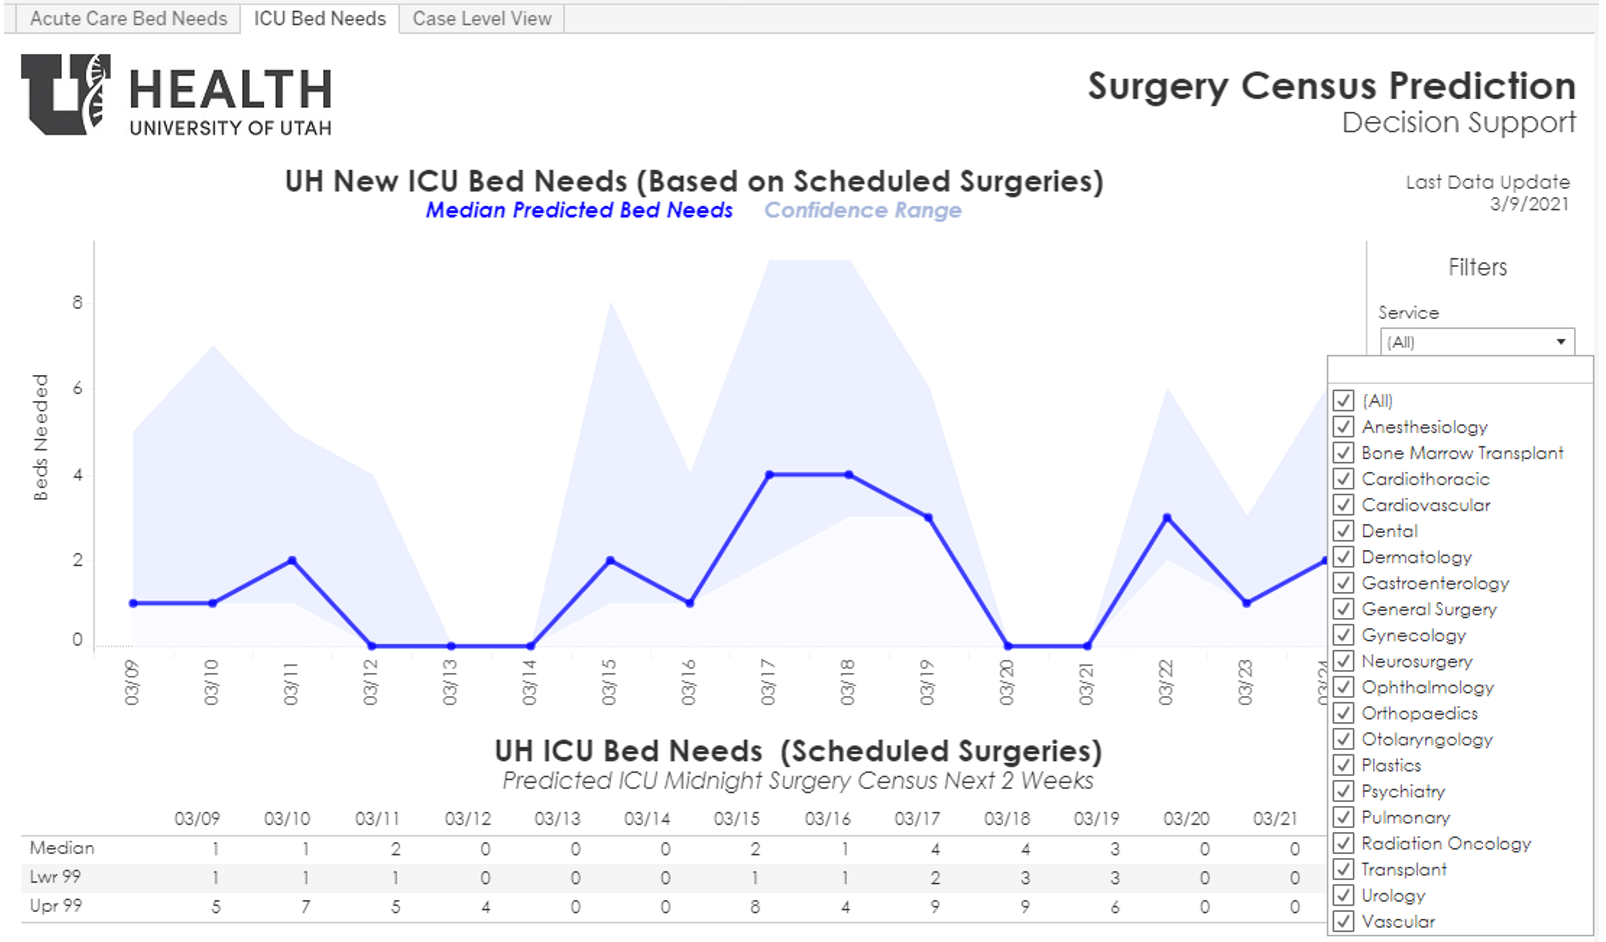
Note: The data in the above image is from March 2021.
By collating this data and visualizing it in a Tableau dashboard, surgeons could make informed decisions about the best cases to move forward with in what order, helping minimize adverse impacts on patients and health system alike. Clinicians applied similar predictive analytics and data visualizations to optimize the use of other hospital and clinical resources, such as exam rooms, further increasing operational efficiency and the patient experience. U of U Health has also applied predictive modeling and visual analytics in other emerging areas, including using data transparency to address vaccination hesitancy by tracking vaccines delivered to internal staff and sharing those numbers with the public.
“Analytics and visualization have been key to providing excellent ongoing patient care,” said Park, “and to sustaining our operations in ways we can afford. Healthcare is a capital-intense business; we have a lot of brick and mortar to support, so the more efficiently we use that space, the better. At the same time, we value patient experience and outcomes above all else. Tableau has been instrumental in helping us meet these optimization challenges throughout the COVID-19 crisis and pushing us to be more predictive with our use of resources going forward.”
We value patient experience and outcomes above all else. Tableau has helped us meet optimization challenges during the COVID-19 crisis, and pushed us to be more predictive in how we use our resources going forward.