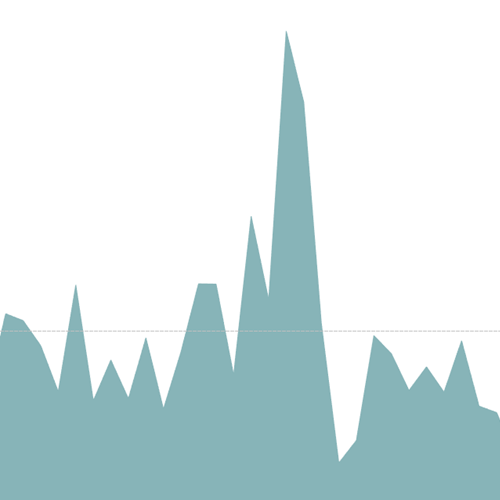
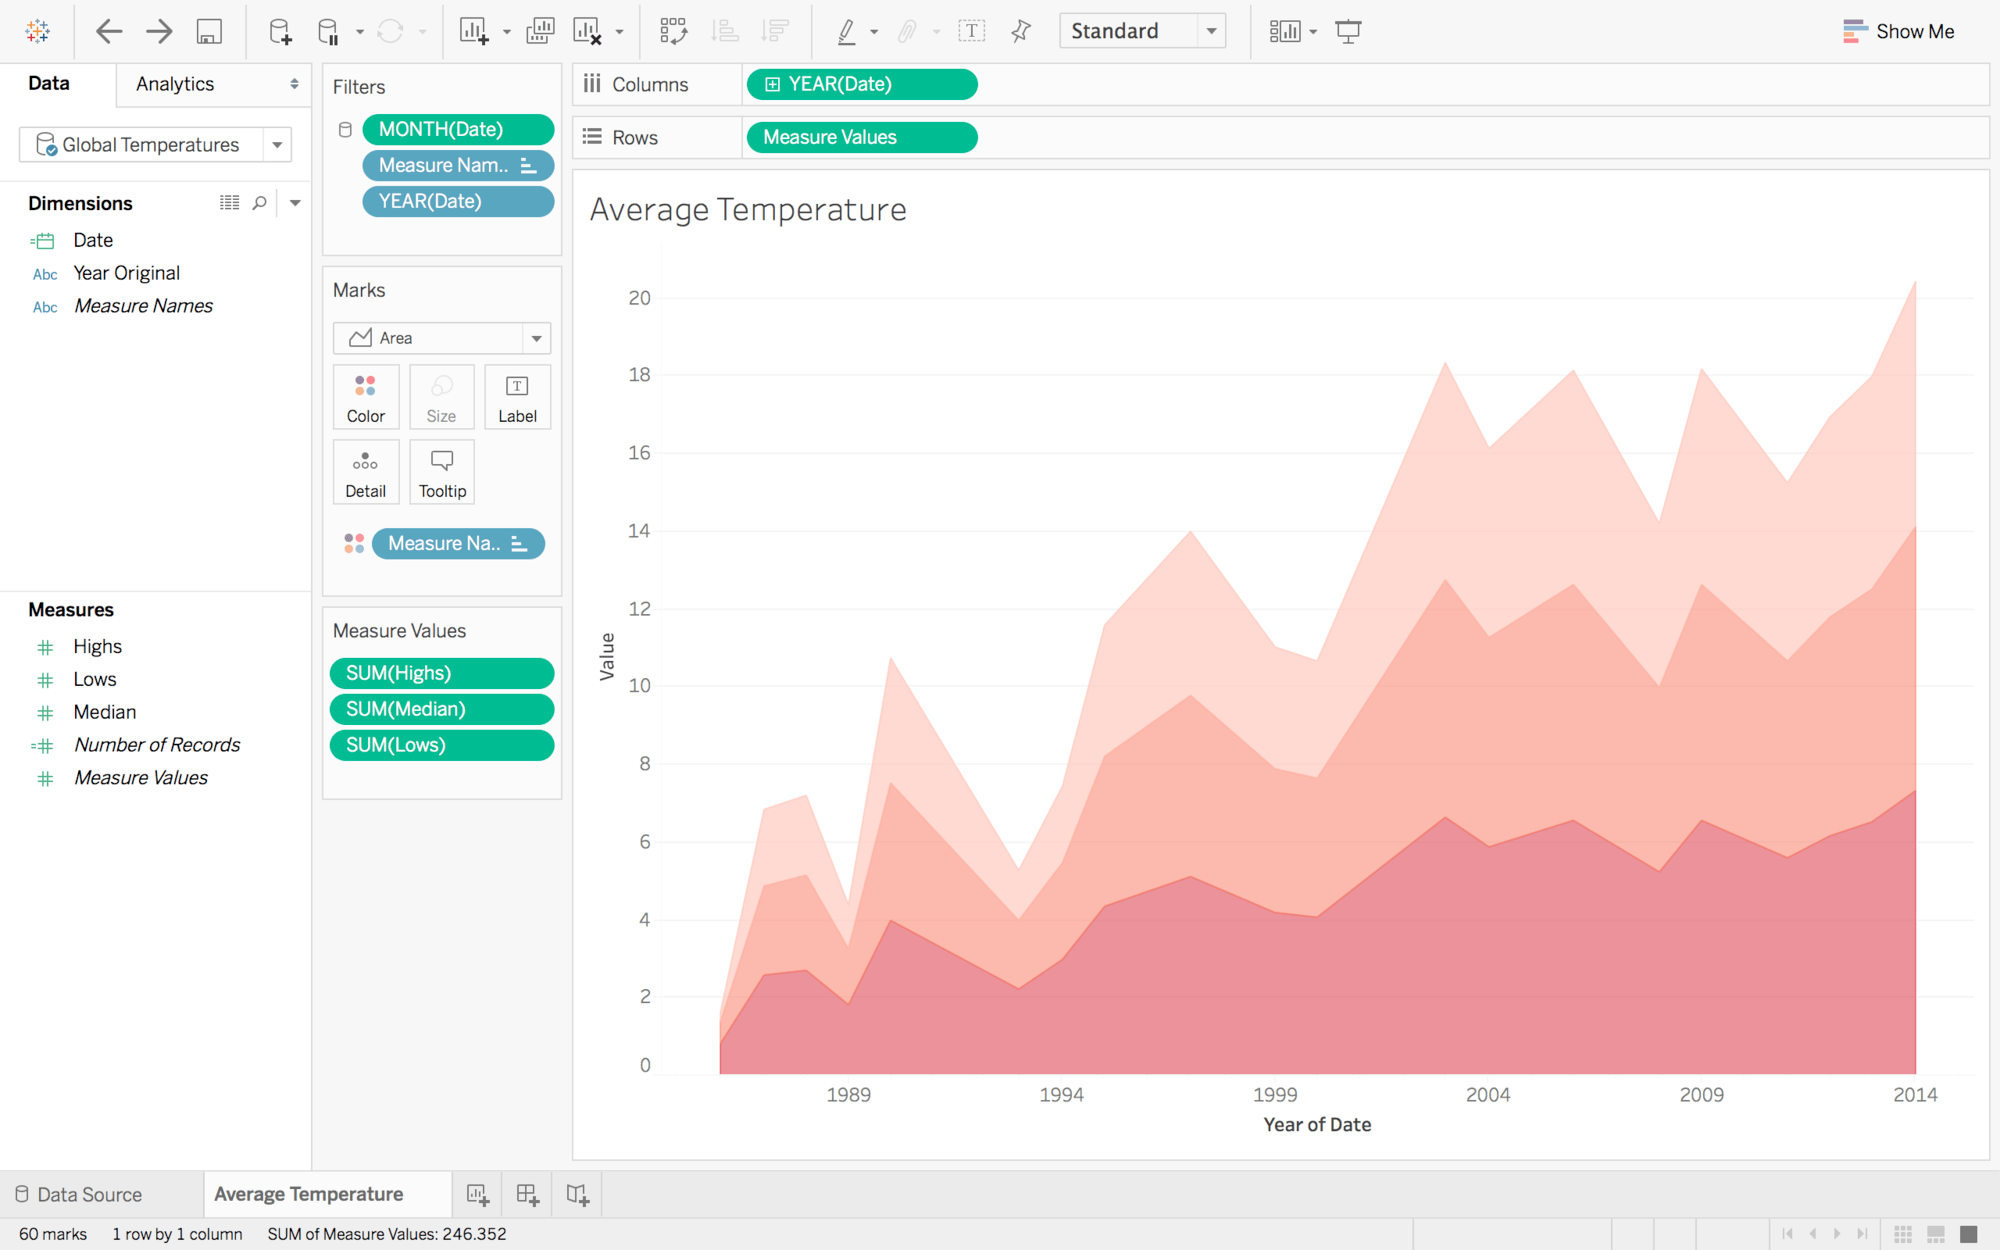
Time series analysis is crucial to understanding your data. The ability to look forward and backward, to drill down from years to days and see data trends over different periods of time is essential for the most comprehensive analysis. Tableau’s built-in date and time functions let you drag and drop to analyze time trends, drill down with a click, analyze times by day of the week, and easily perform time comparisons like year-over-year growth and moving averages.
Solutions
Time Series Analysis
-
Branscher
- Kommunikation, media och teknik
- Energi och resurser
- Finansiella tjänster
- Vård och Life science
- Tillverkning
- Offentlig sektor
- Detaljhandel och konsumentvaror
- Tjänster
- Resor och transport
- Avdelningar
- Funktioner
-
Teknologi
- AWS
- Alibaba Cloud
- Alation
- Alteryx
- Amazon Redshift
- AtScale
- Cloudera
- Collibra
- Databricks
- Dataiku
- DataRobot
- Excel
- Hadoop
- Hortonworks
- IBM
- Informatica
- Jethro
- MapR
- Microsoft Azure
- R
- SAP
- SQL Server
- Salesforce
- Salesforce CDP
- Salesforce Datorama
- Snowflake
- Splunk
- Teradata
- Trifacta
- Vertica
- Webbdatakällor
-
Search
Monitoring data over time with ease
See how multiple dimensions compare over time, spot trends, and see seasonal changes in your data. Time series analysis with Tableau is as simple as drag and drop. With the ability to join separate data sources into a single graph, you'll gain new insights into your data.
This is just the beginning of Tableau's advanced analytics features.
Learn moreBefore it was always numbers in rows and columns. Now I’m eager to see when I do a new analysis, because it's so much easier to actually see the trends, the story, and the power the data brings.
Marta Magnuszewska, Special Investigation Unit Analyst, Allstate Insurance
Time Series Analysis Resources
icon--whitepaper">
Whitepaper
Visualizing Time: Beyond the Line Chart

Arbetsblad
Understand your website's traffic trends
Recent Resources
Fler resurser
icon--online-classes">
Webbinar, på begäran
Visualisera 40 år av The Cures världsturnéer
icon--online-classes">
Webbinar, på begäran
Varför Visuell Analys?
icon--online-classes">
Webbinar, på begäran
Dashboards för marknadsföring: Vad du bör göra och inte göra
icon--online-classes">
Webbinar, på begäran
My Tableau Story with Visionary Lindsay Betzendahl
icon--online-classes">
Webbinar, på begäran
Visual Analytics: Translating Business Questions into Calculations
icon--online-classes">
Webbinar, på begäran
Visual Analytics: Guided Analytics
icon--online-classes">
Webbinar, på begäran
Visual Analytics: Best Practices, Sharing & Collaboration
icon--online-classes">
Webbinar, på begäran
My Tableau Story with Visionary Jim Dehner
icon--online-classes">
Webbinar, på begäran