Iron Viz 2022 Championship finalists demonstrate best-in-class mastery of data skills


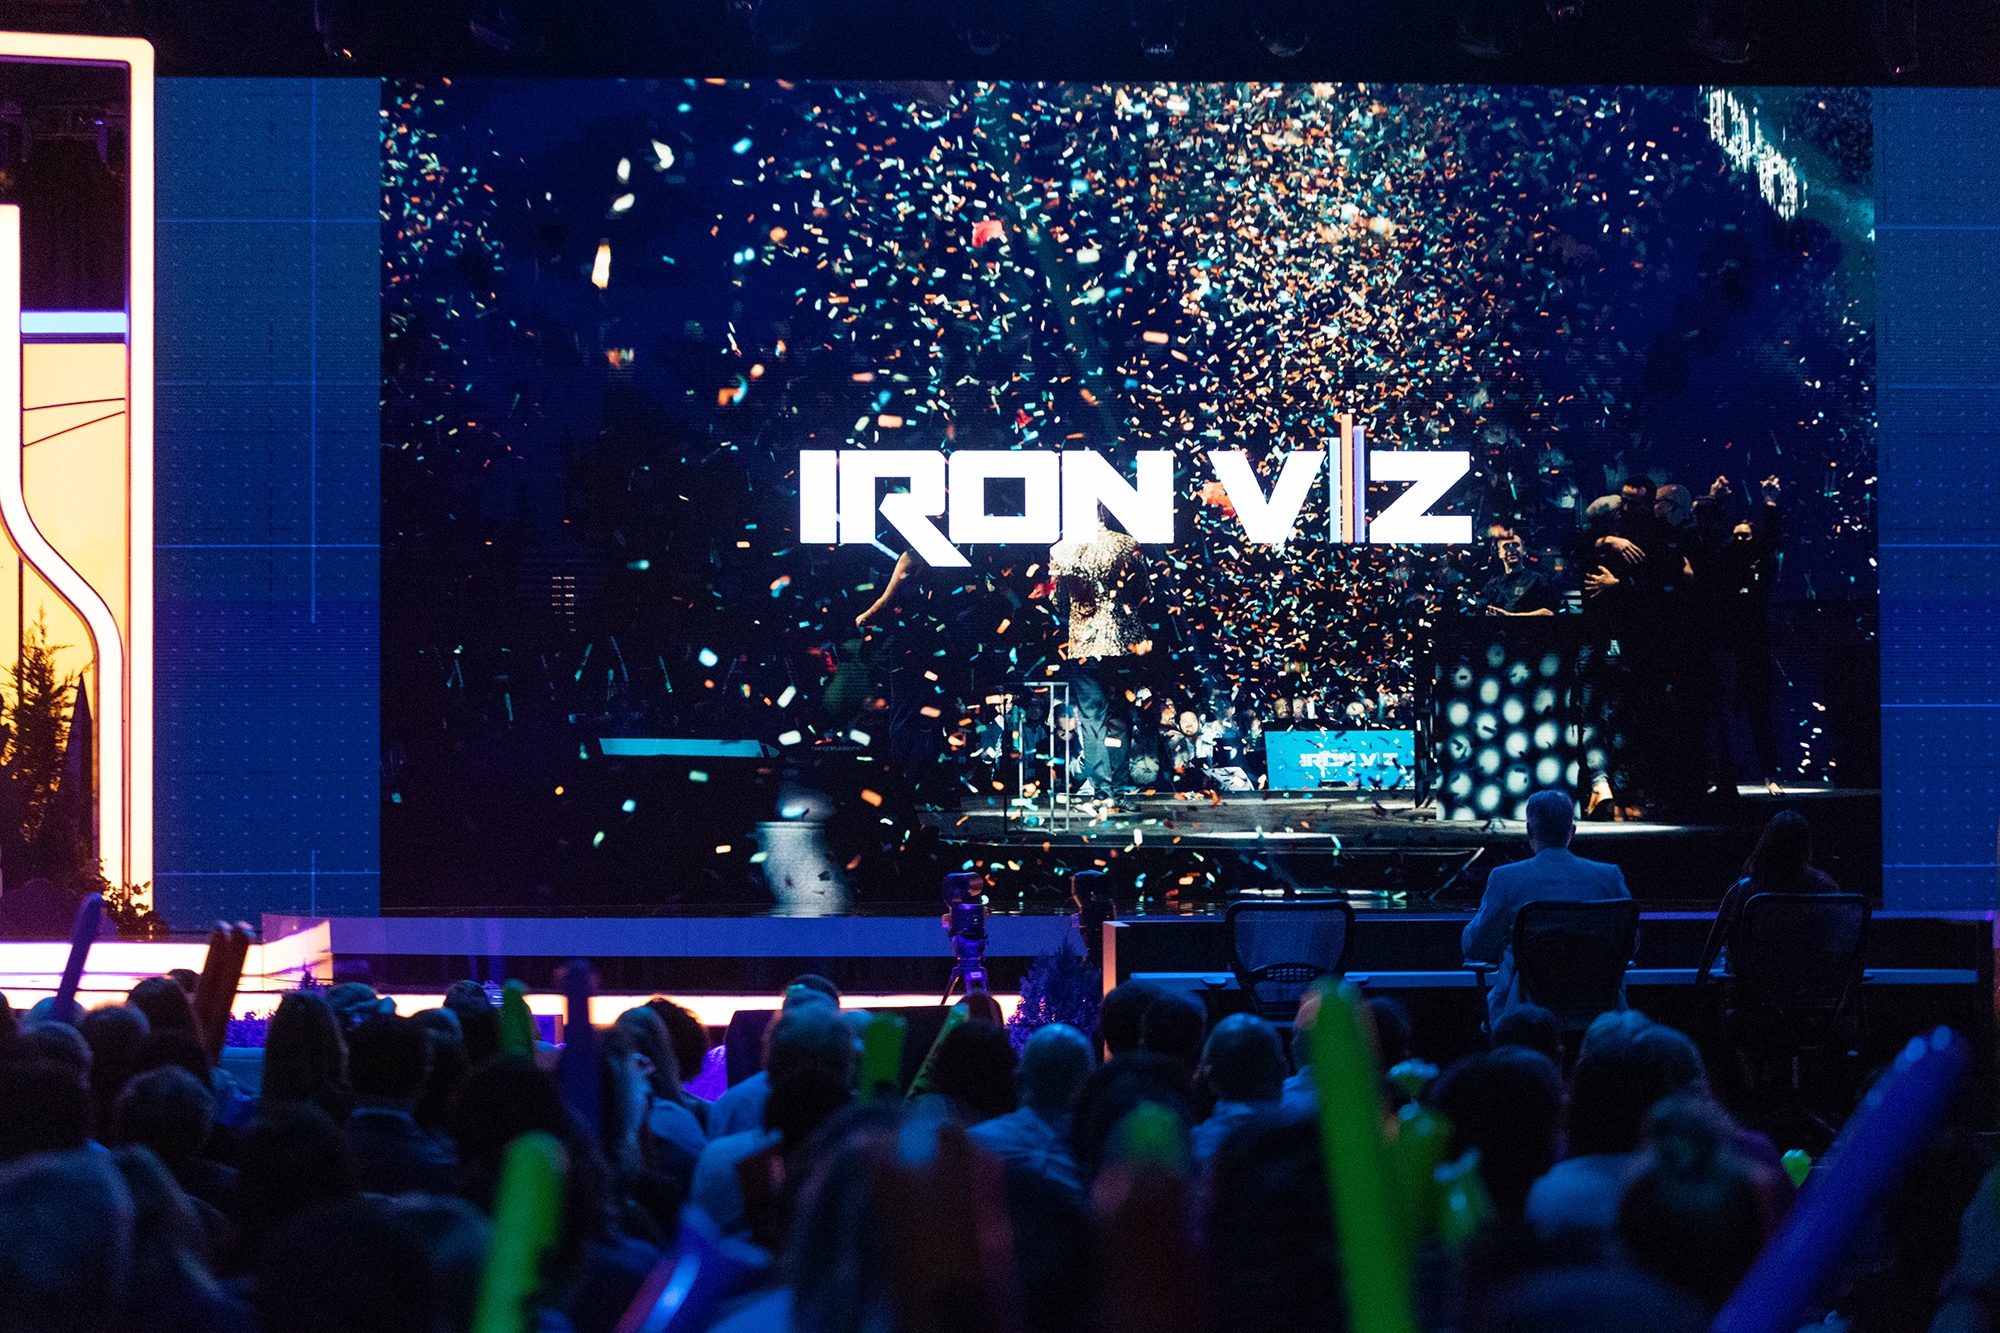
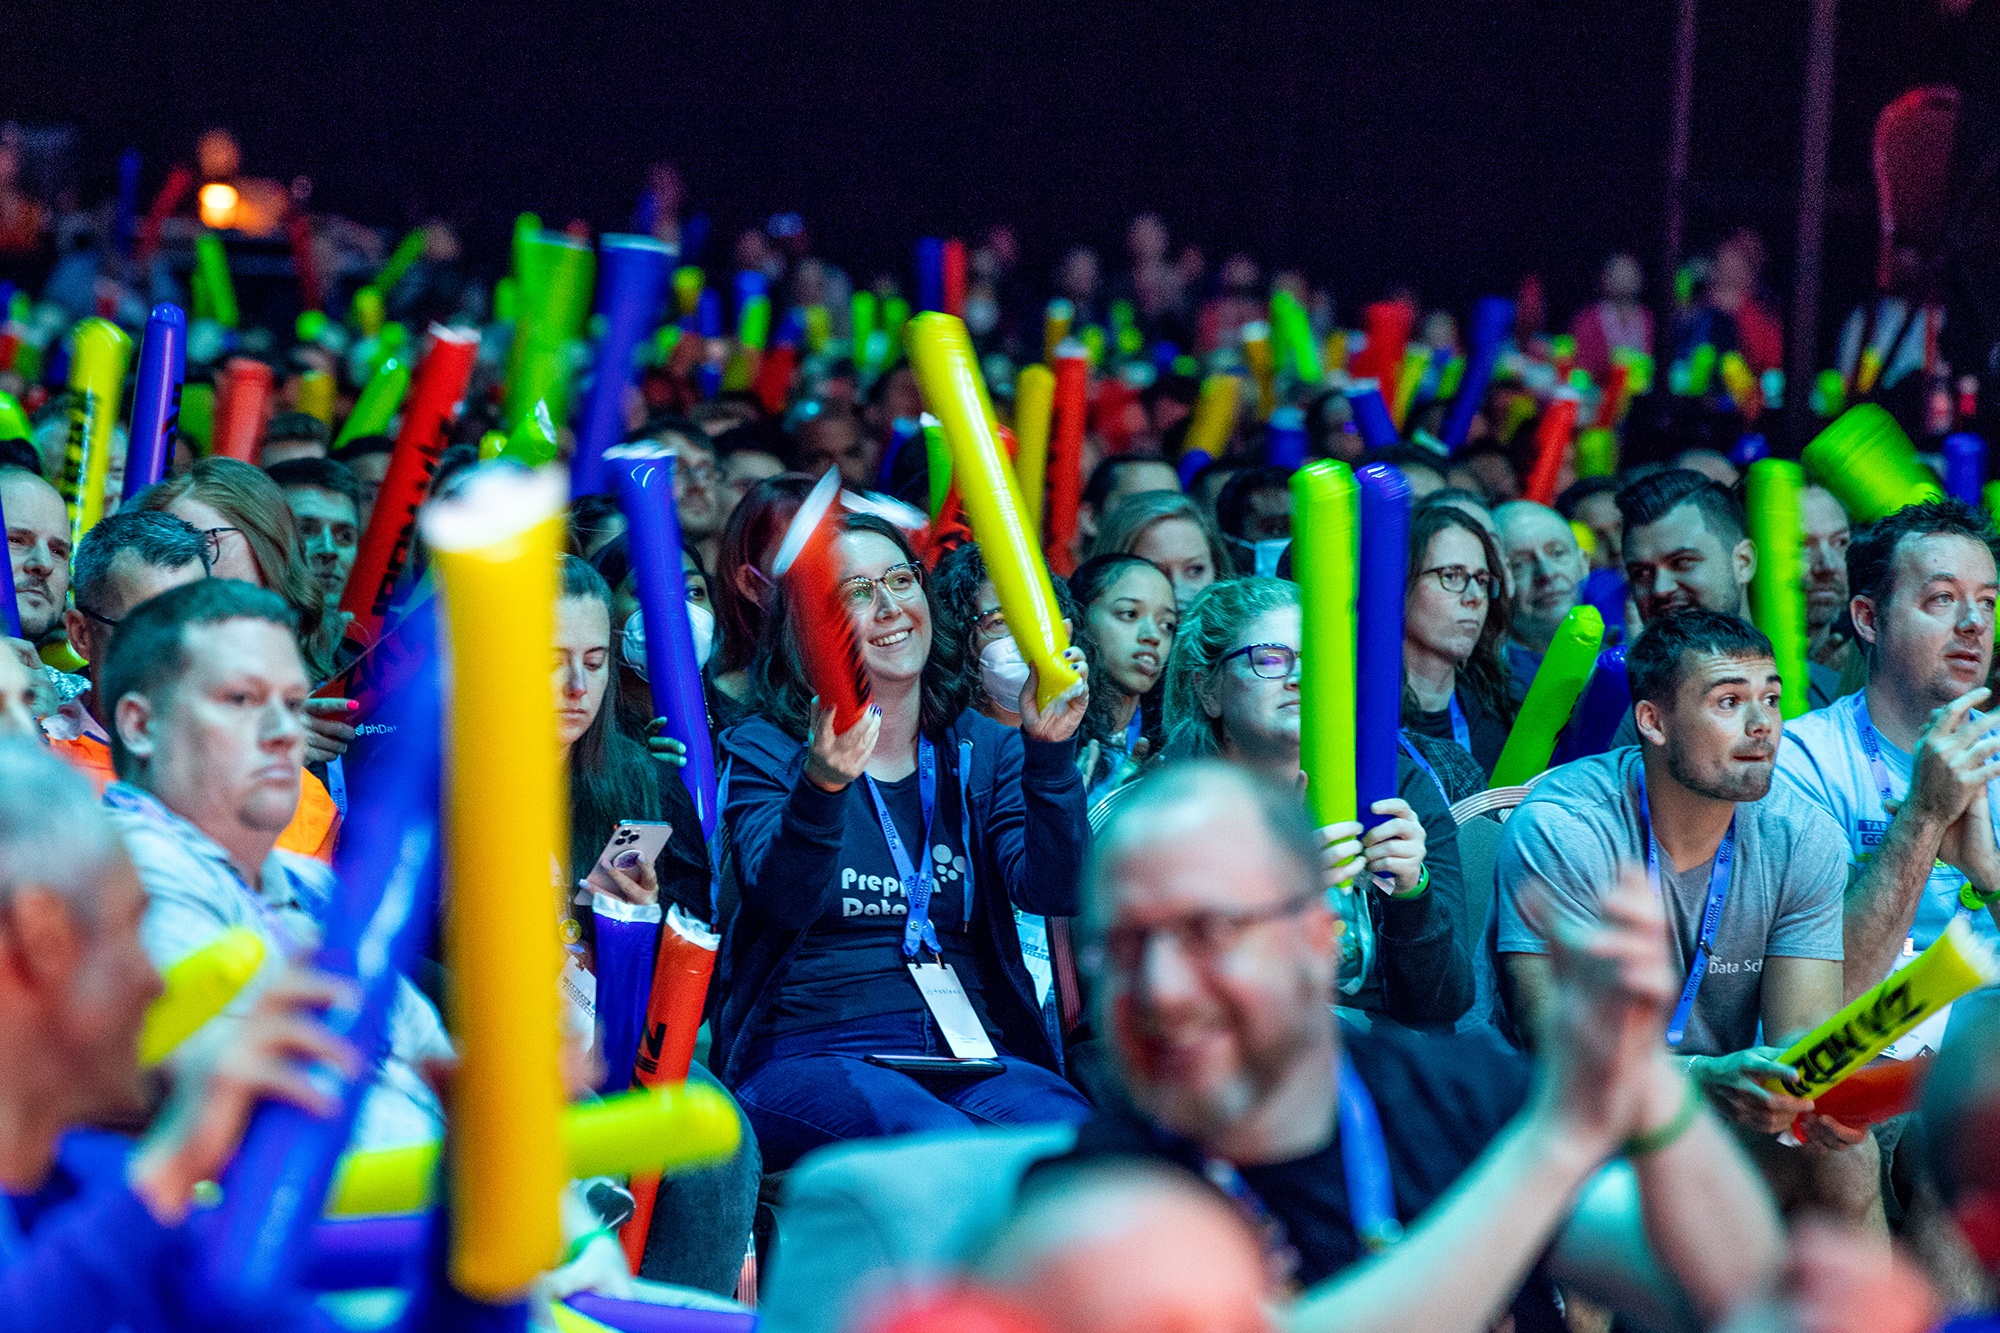
It wouldn’t be Tableau Conference without the world’s ultimate data showdown—Iron Viz. Three fierce contestants took the keynote stage to rock day two with their mad data storytelling skills. The Iron Viz contenders had 20 nail-biting minutes to build an awe-inspiring visualization that would energize and electrify a panel of three viz-savvy judges and a massive live audience of data enthusiasts from across the globe. Which one reigned supreme? You’ll have to read on to find out.
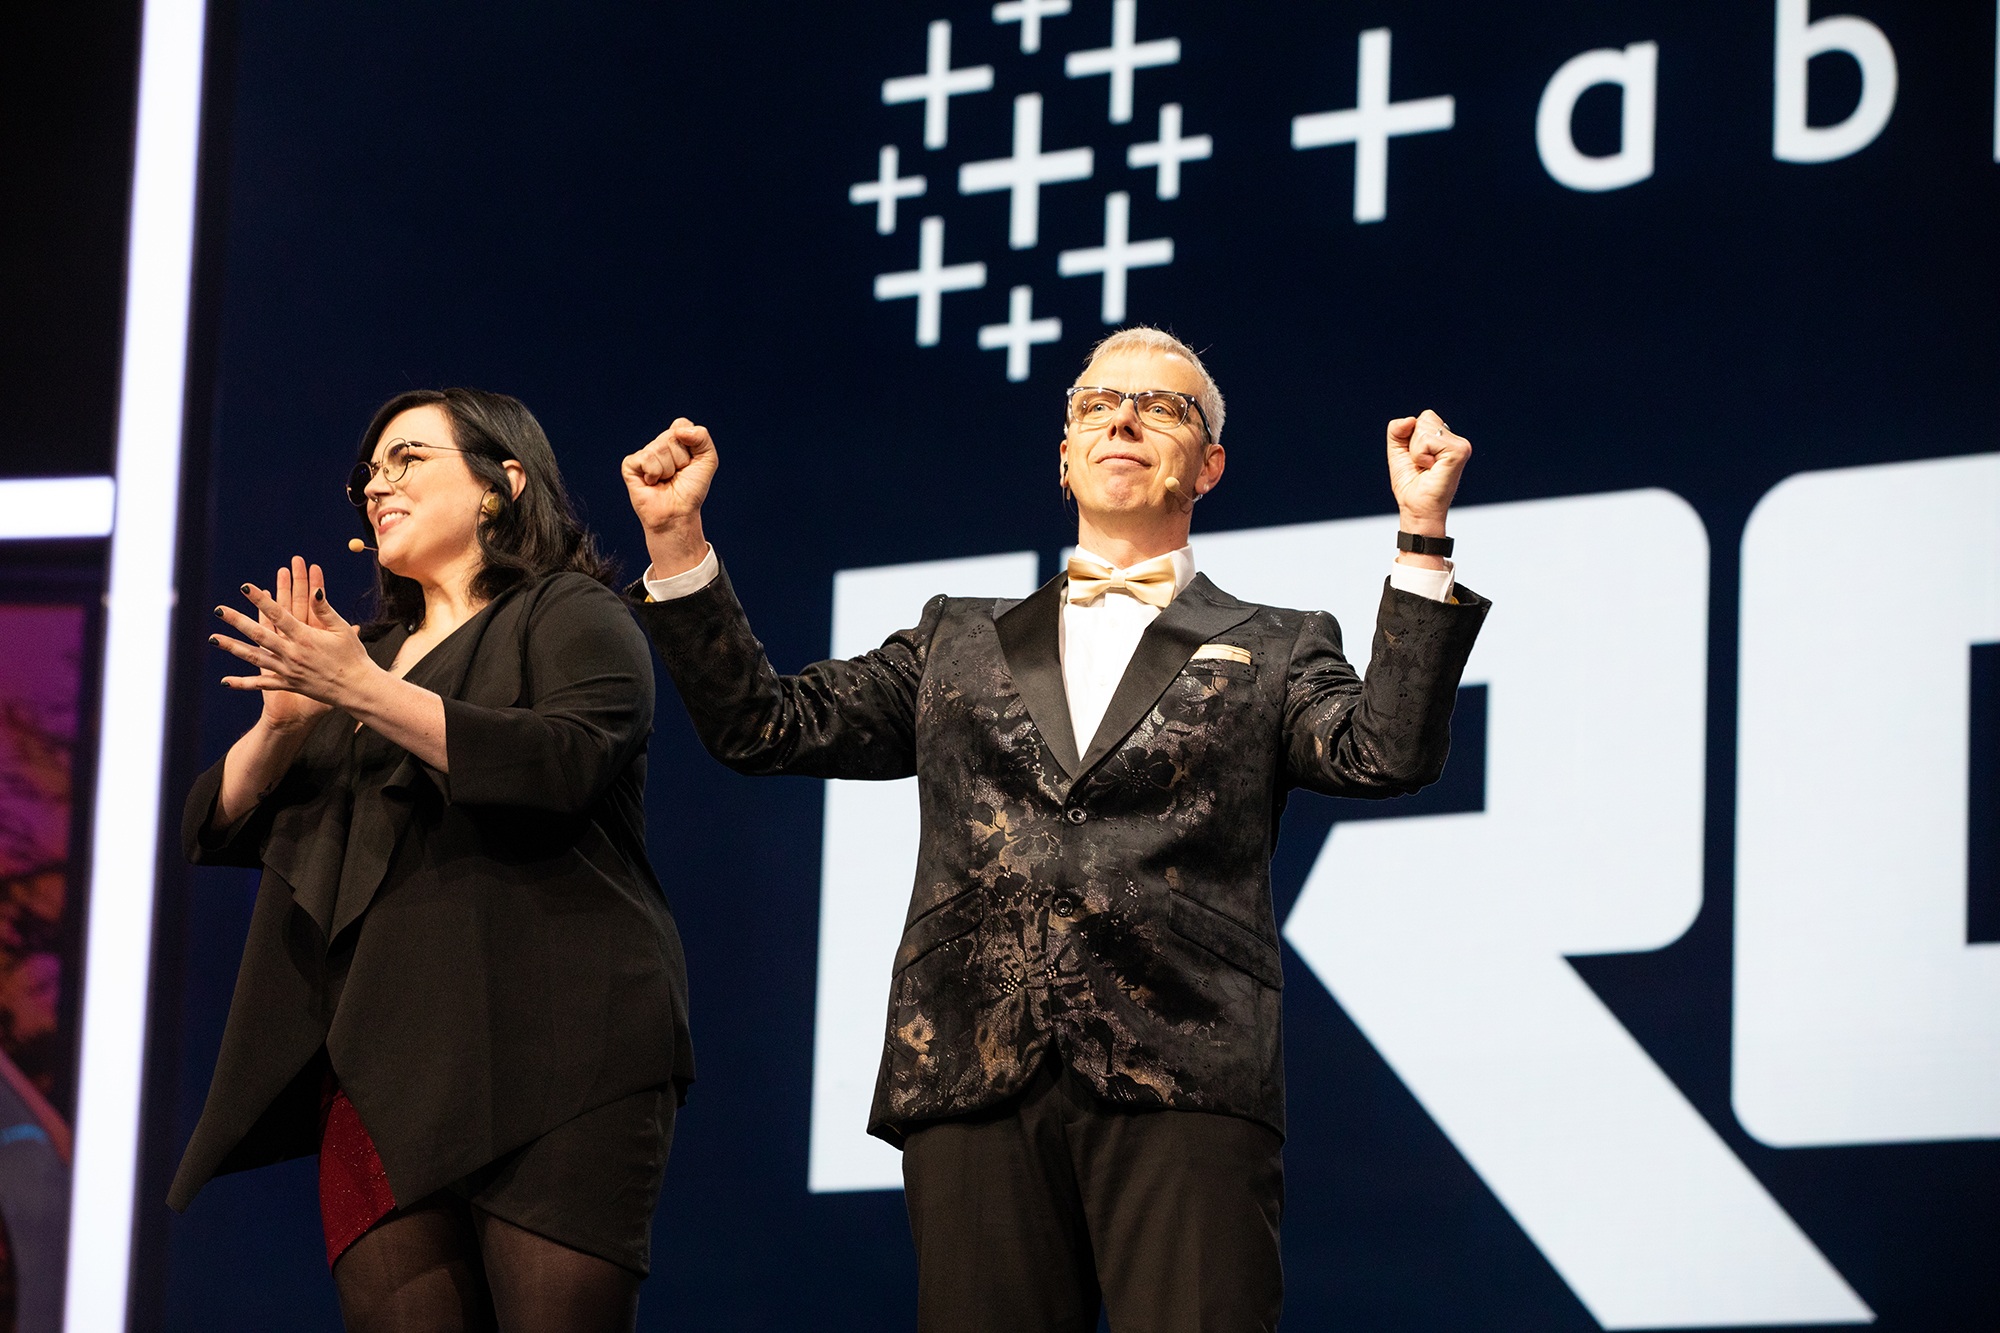
Andy Cotgreave—Tableau’s technical evangelist—was back to host his fifth Iron Viz competition. He brought along a new co-host and partner in crime, Tableau Community Marketing Manager Danika Harrod. Their excitement was infectious as they introduced this year's data rockstars, CJ Mayes, Kimly Scott, and Will Sutton, who earned their place by rising to the top from hundreds of amazing Visualizing the Arts entries. The stakes were high as the three finalists prepared to click, drag, and drop their viz-loving hearts out to be named the champion and win thousands of dollars in prize money for themselves and the charity of their choice.
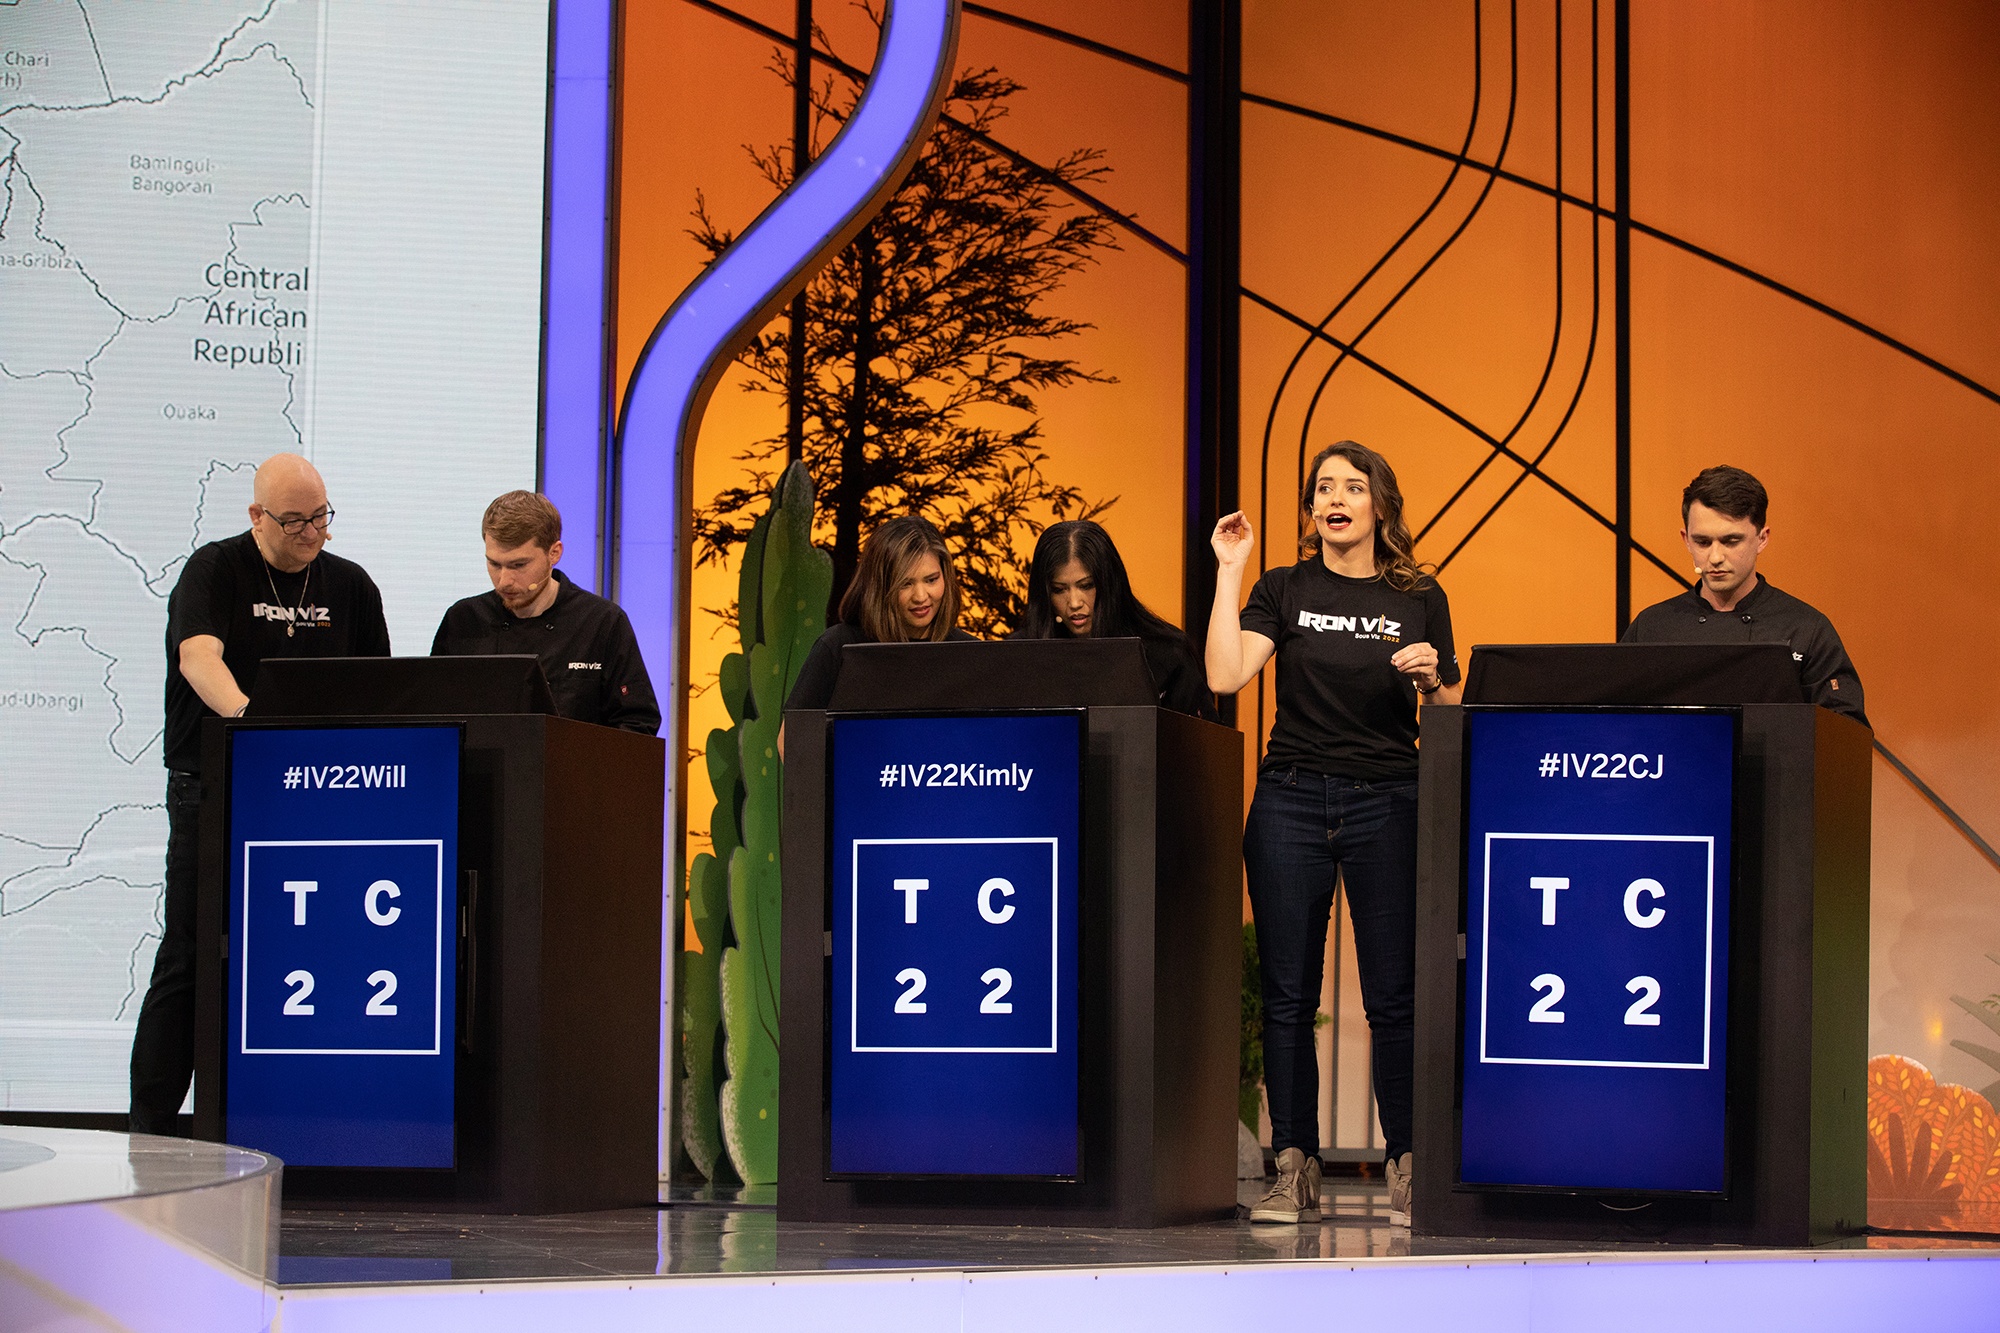
This year’s data set centered around the global impact of education on a given region’s demographics. It was composed of educational statistics and figures by country and year from multiple data sources. Working alongside each contestant was their study buddy, trusted advisor, and fiercest cheerleader, their Sous Vizzer. Each Sous Vizzer brought much-needed product expertise and moral support to our finalists throughout the competition.
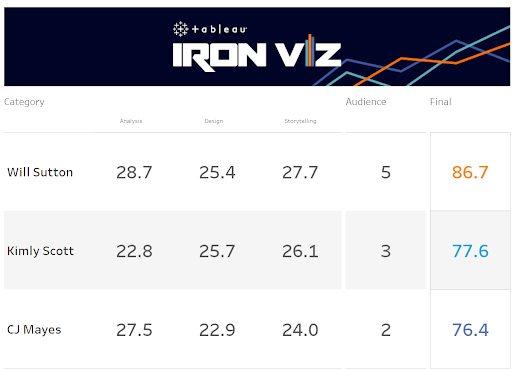
The formidable contenders needed to impress a world-class panel of data experts, composed of last year’s Iron Viz Champion Lisa Trescott, Tableau VP of Research and Design Dr. Jock Mackinlay, and Tableau Public Director Taha Ebrahimi. The judges evaluated the vizzes based on three criteria: design, analysis, and storytelling. The judges' score made up 90% of each contestant's total score, while the audience weighed in with the remaining 10% of the votes via text. Let’s take a deep dive into the powerful data stories our finalists told.
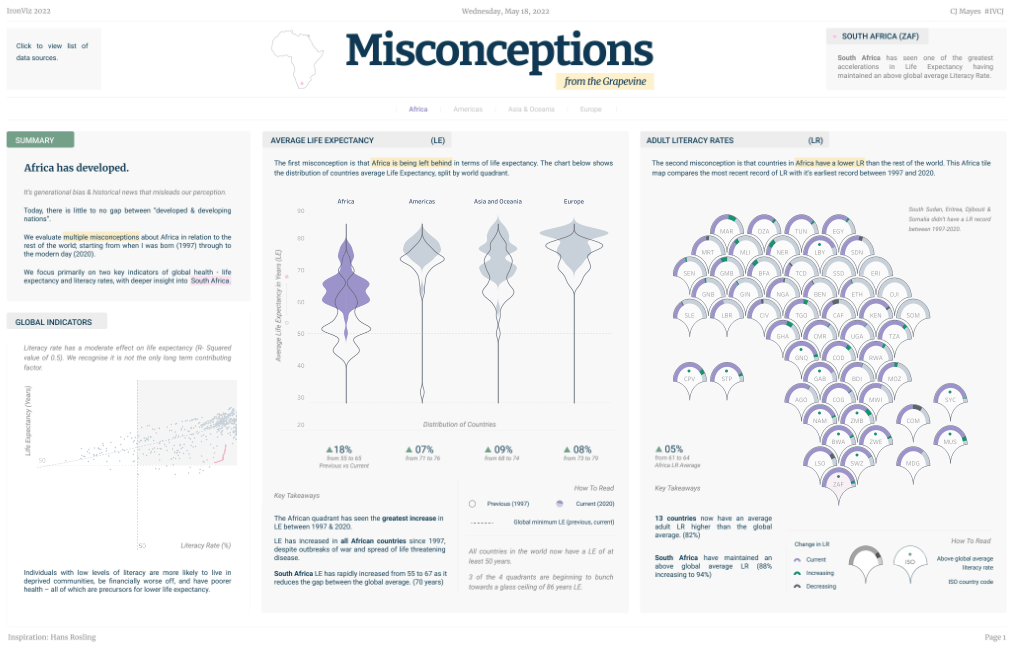
Misconceptions from the Grapevine
CJ Mayes’ inspiration for the direction of his build was the book Factfulness: Ten Reasons We're Wrong About the World – and Why Things Are Better Than You Think, which explores how generational bias and misinformation can change our perception of the world. He looked at two global health indicators—life expectancy and literacy rate—impacted by generational bias and historical information. CJ created his viz in newspaper layout, and his overarching theme played stylistically on the word grapevine by analyzing multiple misconceptions. He included a violin chart showing distributions of numeric data for one or more groups using density curves. CJ then took a deeper dive and focused on a case study of South Africa—a country that, for the past 20 years, has had an above global average literacy rate. He showed how that helped support a booming life expectancy which grew by 22 years during this time period, now sitting just shy of the global average.
Two Countries
Kimly Scott, a Cambodian-Australian, took the audience on a personal journey using education metrics to illustrate how different her life would have been if her family had returned to Cambodia after the war. She succinctly and eloquently told her data story of how quality education impacts individuals and their country. She designed the text to aid accessibility which is very important to her. Kimly used the imagery of a little girl to represent herself and a flashlight to shine light and draw focus on the vizzes. This visual effect expresses how data can help us see the world. Her analysis demonstrated that had her family not remained in Australia, she may not have had the same opportunities, including the chance to compete on the Iron Viz stage. She ended with the call to action that education is a human right and a Malala Yousafzai quote—“Let us pick up our books and pens. They are our most powerful weapons. One child, one teacher, one pen, and one book can change the world. Education is the only solution.”

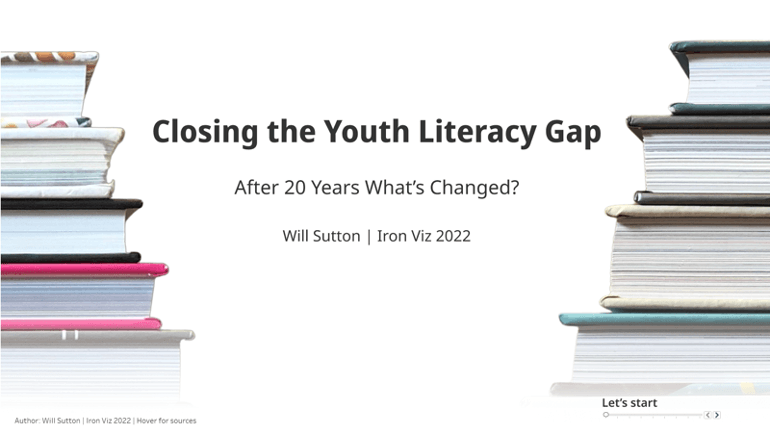
Closing the Youth Literacy Gap
Will Sutton built his visualization to analyze the changes to youth literacy over the last 20 years, its impact on the world, and where we should be looking to close the global youth literacy gap. He took a very complex data set and focused on the human element—every data point was a human life. Will's viz employed original and new Tableau features, and he tastefully used animations to tell a compelling story. Sous Vizzer Mark Bradbourne may have coined a new DataFam term when he described the animation as sprinkled throughout the build like “viz bae,” much to the delight of host Andy Cotgreave. His superb data storytelling effectively demonstrated that when we affect change on an individual, it also affects change to benefit everyone around them. He concluded with a call to action to support literacy and help create a fairer global education system.
And the winner is…
It was an outstanding performance and dazzling display of data storytelling from all three contestants. The work they produced was mind-blowing. Each Iron Viz finalist had a very different approach, but all three wowed the crowd. One viz simply out-edged the competition. Congratulations to Will Sutton and his charity, UNHCR, in support of the Ukrainian refugees.
See a breakdown of each contestant’s score below:
Don’t want the excitement and mastery to end? Iron Viz is a chance for amazing vizzers who spend their days on Tableau Public to give the world a behind-the-scenes look at their magic. So go on—get energized by the over 5 million interactive data visualizations created by more than 2 million people globally. From music to sports and politics, there's a viz to explore for almost any topic. And a new storytelling masterpiece is featured daily on Viz of the Day. Sign up to have a healthy dose of 'viz-spiration' delivered to your inbox.
This officially ends Iron Viz 2022. It proved to be another memorable competition. Congratulations to all who participated, and again, well done, Will. What an inspiring performance.
Relaterade berättelser

Iron Viz 2026: Read Between the Data
 28 Maj, 2026
Top 10 Qualifiers for Iron Viz 2026
