How analytics helps cash flow management by uncovering key details


Businesses’ financial transactions have a degree of complexity and provide exposure. With lack of understanding for the underlying transaction details, there’s exposure to risk, strong probability of missing data, and a chance of data duplication, just to name a few considerations. And without understanding the details, financial and company leadership question their financial standing. Are they in the green, black or red, and what factors impact their position? Using a business intelligence solution such as Tableau, there are no unanswered questions with transactions and there’s clear understanding of your cash flow—critical in a fast-moving, competitive environment where non-cash payment transaction volume has reached $433.1 billion, according to the 2017 World Payment Report from Capgemini and BNP Paribas.
Historically, most companies monitored transactions by looking at month-end bank statements in their accounting ledger. Traditional cash flow analysis software relied on your accounting software to analyze operating activities, investment activities, and financing. That poses a problem. First, the software looks at a static perspective and quickly becomes irrelevant. It also doesn’t factor in data outliers and multiple touchpoints of a transaction. Leveraging a BI solution to capture your financial data from multiple sources will minimize the friction of capturing all information layers to perform effective, thorough analysis.
Some important benefits that finance and companies will achieve from using an analytics platform for enhanced transaction control are:
- A stronger connection and collaboration with financial partners. By using resources like Tableau and the SWIFT financial messaging network to connect with financial partners and current financial messaging formats based on ISO 20022 XML, you can feel confident data from your bank statements is consistently captured. And you’ll work from the same set of information for cash balances and transactions with a daily or even near-time view.
- Reduced risk with a 360-degree view of financial exposures to issuers, countries, currencies, counterparties and business sectors. Dashboards lend a view into transaction counts for open bank accounts. Seeing a comparison of that data, you’ll uncover idle or low activity accounts ripe for closure and can take action so there’s less to import and less risk tied up.
- Stronger financial forecasts with a better grasp on your current position and where you've been. It’s been challenging for companies to get a handle on the trends and patterns of their transactions when trying to wrangle data from so many sources. Using visual analytics, you can look from month-to-month, quarter-to-quarter, and year-over-year with aggregate, drill- down and drill-through views.
- Data that works harder and is more valuable as all sources are collected and analyzed together. This goes without saying; an aggregate view of transactions is an empowering view of your money. Constant collection and analysis of financial transactions using a BI platform means the quickest time to the truth.
Several customers, partners and our own Treasury team leverage Tableau and visual dashboards to capture all transactions, which has resulted in a clearer, detailed view of where we’ve been, where we are and where we’re headed financially. The outcome is:
- Everyone speaking the same language around data since there’s a common source of information;
- Deeper levels of analysis from bank statements, investment activity and positions, foreign exchange exposures, merchant services, and corporate credit cards, by blending the data together to drive value for the organization;
- Enhanced understanding for business users by seeing the most vital information to them with drill-down to underlying transaction details;
- Stricter monitoring to spot duplicate or missing data, transaction trends, idle account balances, and outlier transactions;
- Significant TIME SAVINGS
As a member of our treasury team, I’ve personally found that using some of the reports I’ll share has empowered me to answer almost any question passed our team’s way. We’re responding in a timely manner and realizing efficiencies that provide us time to think about the strategic implications of the data.
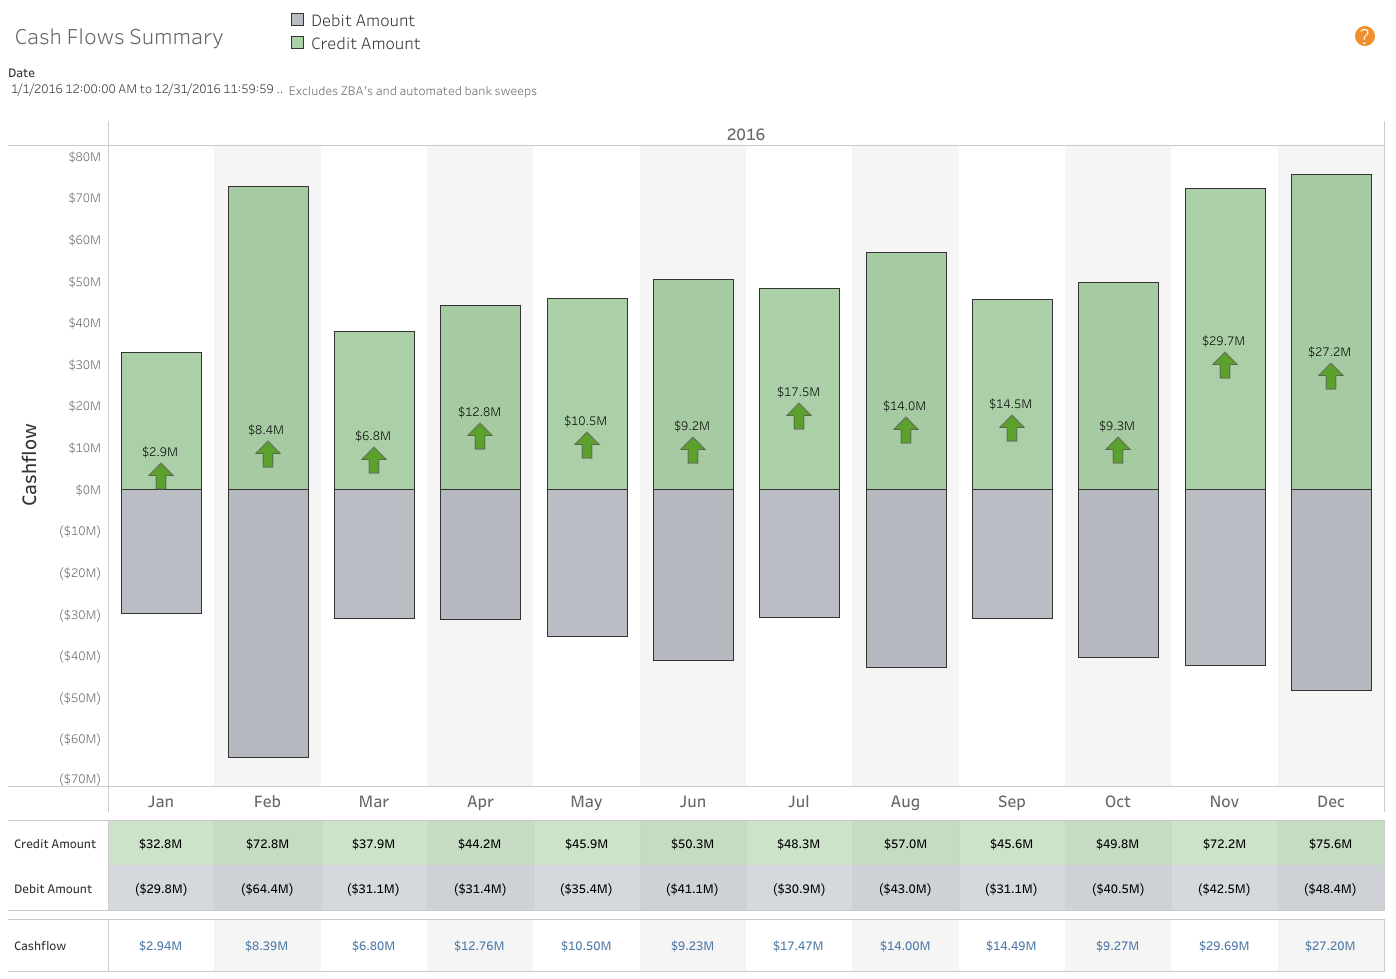
This dashboard captures all cash flow data in aggregate dollars or can be distilled into any view by currency, geography, country and distinguished by amount of credits and debits. Factoring in all constituencies and being able to filter based on priority and needs is critical.
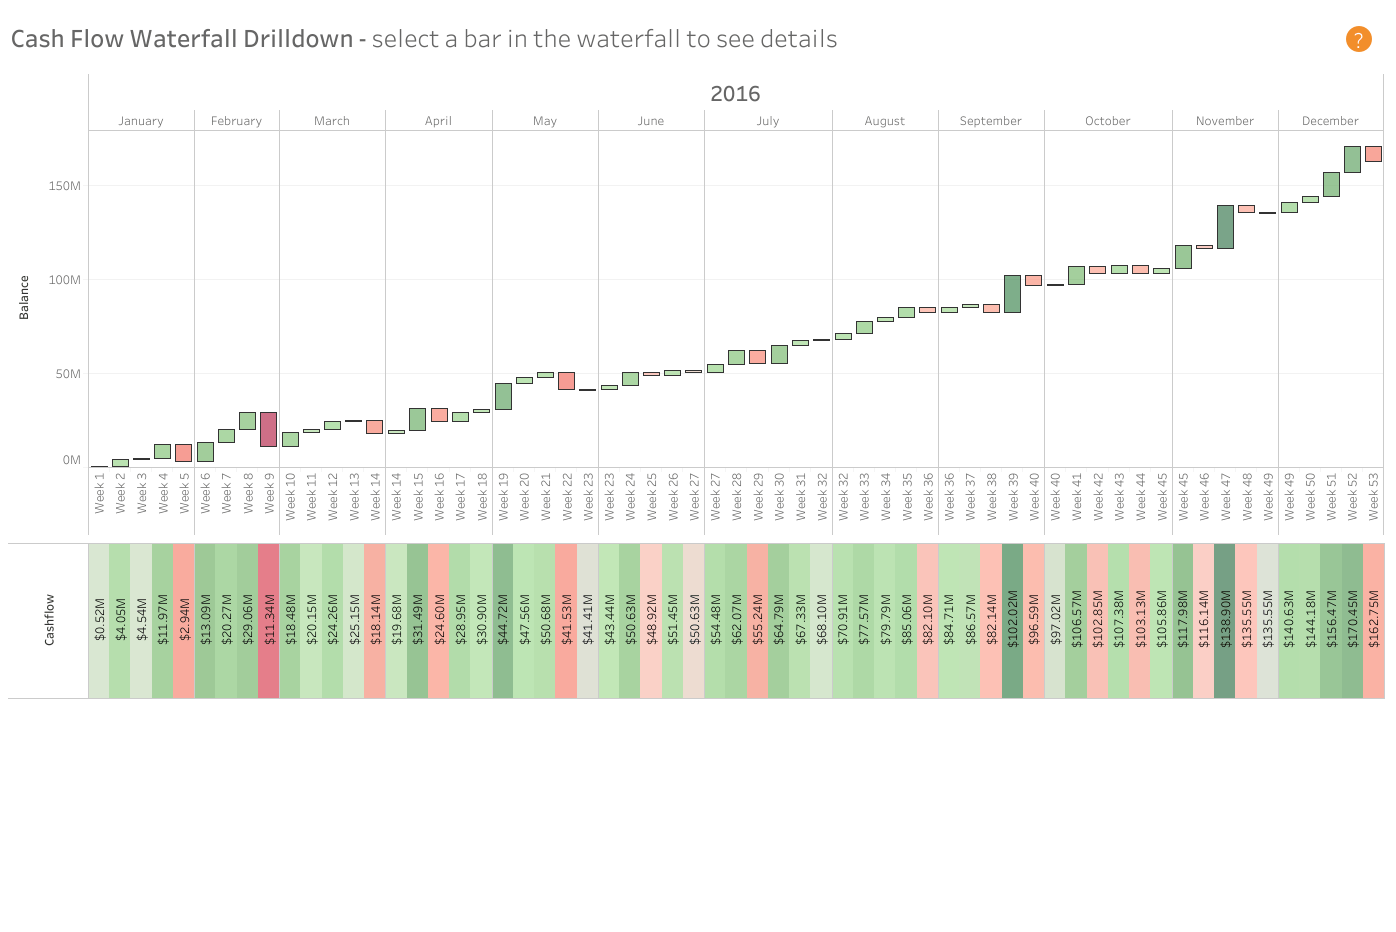
This waterfall format allows for data outliers to be detected more easily. Drilling down into the underlying bank accounts reveals transaction activity for a specific day, week or month and presents an output to understand what transactions or business activity impact cash flow the most.
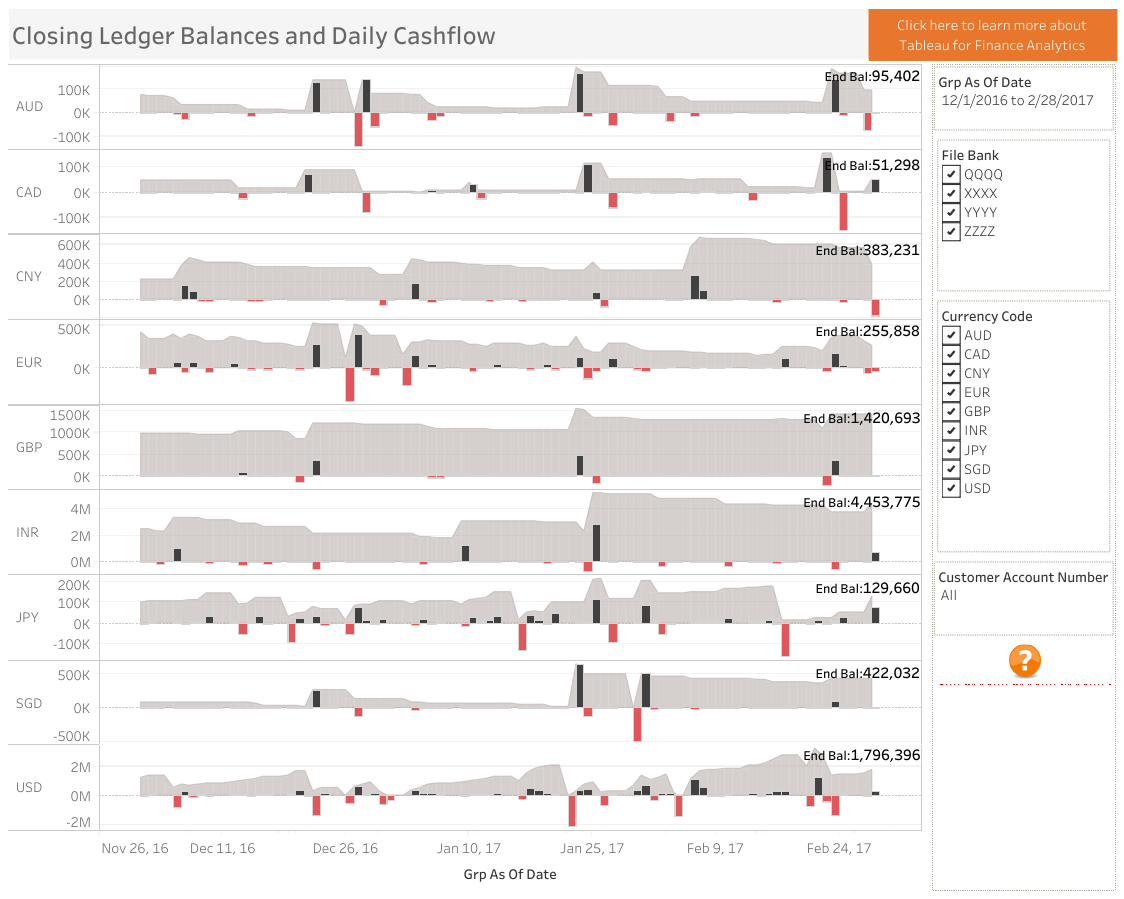
The Tableau Treasury team uses a similar workbook to track banking statements and balances across multiple accounts and currencies. This dashboard will help finance teams understand cash composition over time and help you analyze outliers to understand key drivers.
![]()
Being able to query with payment information provided from a customer is important and when dealing with overseas customers. A lot of payment data gets truncated or dropped off so leveraging text string details to search transactions can capture key information gaps.
Information is power—especially when trying to keep tabs on the health of your business and understanding your financial position. To learn more about the ways in which business intelligence solutions like Tableau put you in control of knowing your cash flow, view our webinar on a Modern Approach to Cash Flow Analysis.
Relaterade berättelser

VizQL Data Service from Tableau: Use Your Data, Your Way
 8 Augusti, 2024

When and How to Use Multi-fact Relationships in Tableau
 1 Augusti, 2024

Top data books of 2021
 12 December, 2021