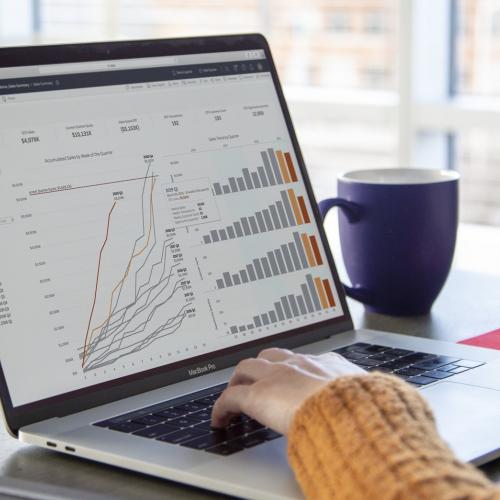
Doubling the pace of development with Tableau


Agencies and advertisers choose the intelliAd performance marketing platform to track and optimize their online marketing efforts. In this video, Head of Data Science David Müller talks about how much faster his developers can work with help from Tableau.

Tableau: How would you describe Tableau to someone who wasn’t familiar with our software?
David Müller, Head of Data Science: I’d describe Tableau to friends and work colleagues as a tool that just hugely facilitates the interactivity of data analysis and interpreting data.

I’d describe Tableau as a tool that just makes data analysis and simply dealing with data enormously simplified.

Tableau: How were you building reports prior to finding Tableau?

I’d say that the pace of development has at least doubled for this kind of report. Tableau has had a great impact on our team.

David: Previously, we had increasingly used Microsoft Excel, where the development time for an interactive product, even in the case of Microsoft Excel, is gigantic, because this interactivity is simply not there. And when compared in relative terms to Tableau, we could see that within a few days we achieved good results.

In Tableau, we were simply able to drag and drop the data in; we took care of the data aggregation, but after the data aggregation we didn't incur any more development costs, we just had to maintain a report template and then we quickly got to the interesting reports. If I had to give a figure, then I’d say that the pace of development has at least doubled for this kind of report.

Tableau has had a great impact on our team

Tableau: How is your team using Tableau?
David: We’re a technical team - all our employees have a strong focus on IT, and a lot of coding is done in-house.

Our work is divided into two parts: 50 percent might be spent working directly on the code, and 50 percent is then done in Tableau.

So for us, and above all for the members of our team, Tableau has become a part of everyday work.

Tableau: Is speed the primary reason you’re using Tableau more and more?
David: The reason why we now increasingly use Tableau is ultimately that we have noticed that it is a good tool, especially with version 8.1, the most recent version fulfills our requirements to an even greater extent; also that it is increasingly in use by our customers within the online marketing sector. For example, we have a large agency and customers who place greater emphasis on Tableau, have their own Tableau Server and are naturally pleased when we also have Tableau products as this makes integration somewhat easier.

Tableau: Finally, are your customers finding any surprises or unexpected results in the data you’re showing them in Tableau?
David: Just thinking about it now, about which ‘Eureka’ moments we had with customers, they have come from the offered interactivity alone.

As soon as we go to the customer and directly say, “I’ve brought specific other factors to this use-case”, for example gender or region, then these are things that I generally always want to look at to see where my measures were better, did they work for a specific gender?

This is only partially offered in web front-ends, and partially not. But we can join precisely these demographic data, really well, and then integrate them with Tableau.

With the customer, this then always results in ‘Eureka’ moments, because they’re still not used to this kind of interactivity in data analyses.