Tableau voor specifieke sectoren
Analyse van detailhandel en consumentengoederen
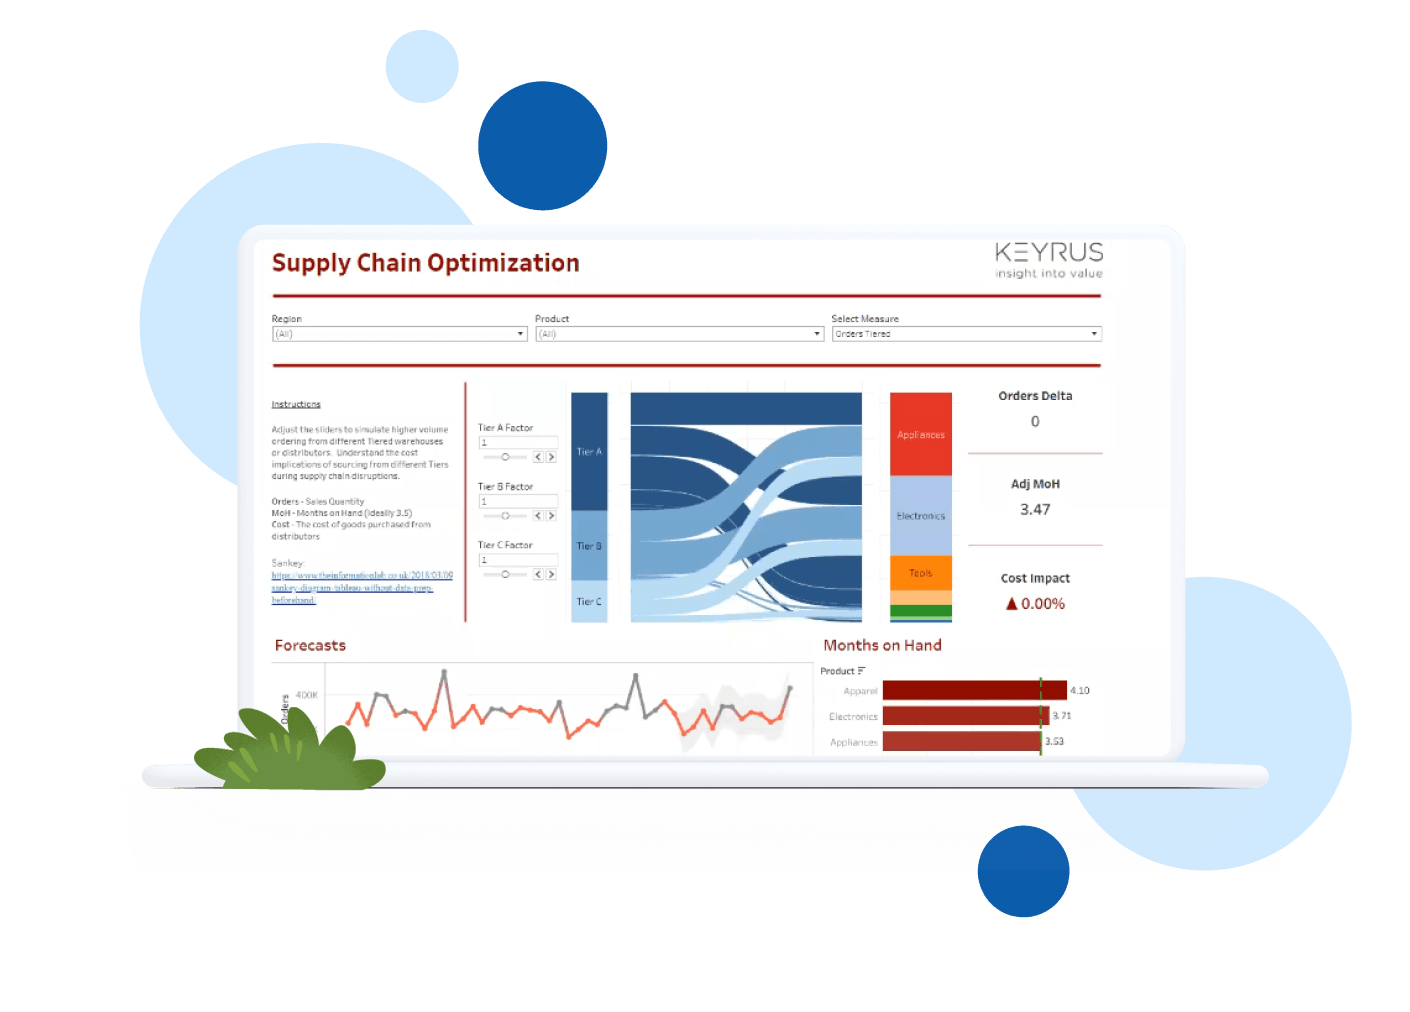
Maak de toeleveringsketen flexibeler, bevorder slimme besluitvorming en creëer gepersonaliseerde omnichannel-belevingen
Zet je data om in bruikbare inzichten
De detailhandel en organisaties die handelen in consumentengoederen, moeten hun data inzetten om de concurrentie voor te blijven. Bekijk een gebruiksscenario van een belangrijke speler in deze sector om te zien hoe dashboards voor optimalisatie van de toeleveringsketen detailhandelaren beter inzicht geven in hun digitaal verbonden toeleveringsketen, waardoor ze verstoringen effectiever kunnen beheren.
Bekijk hoe het dashboard werkt in de praktijk
Analyse van consumentengoederen
Gebruik data-intelligentie om de toeleveringsketen flexibeler te maken, de groei te versnellen, de klantbeleving te verbeteren en veerkracht op te bouwen.

Analyse van de detailhandel
Bereken de verwachte vraag, beperk verstoringen in de toeleveringsketen tot een minimum en creëer één unieke databron voor klantgegevens.

Onze klanten aan het woord
Mondelēz International
Ontdek hoe deze fabrikant van snacks en zoetwaren zich heeft toegelegd op digitale inkoop, waardoor het bedrijf miljoenen dollars en 7000 uur per jaar bespaart.
Lees het verhaalTableau is een zeer krachtige tool die ons snel inzicht geeft in de dingen die we willen zien, op het niveau waarop we ze willen zien.

REI gebruikt duidelijkere klantinzichten om gepersonaliseerde belevingen te bieden
Ontdek hoe verbeterde klantanalyse REI helpt om de klantbeleving kracht bij te zetten.
Lees het verhaal
Brown-Forman transformeert marketingstrategie met Tableau
Ontdek hoe deze distillateur visuele analyse gebruikt voor meer naamsbekendheid en om transparantie te krijgen in de SKU’s in 160 landen.
Lees het verhaal
McDonald’s biedt een betere klantbeleving met Tableau
Lees hoe managers van McDonald’s interactieve dashboards gebruiken om de benchmark voor prestaties af te stemmen op andere restaurants en om de service efficiënter te maken.
Lees het verhaalSalesforce en Tableau
CRM Analytics is een compleet intelligent platform gebouwd op Salesforce, de top 1 CRM van de wereld. Het platform biedt vermogensbeheerders een native analyse-ervaring. Salesforce-gebruikers die de productiviteit willen verhogen, kunnen intelligente, bruikbare inzichten krijgen, direct vanuit hun workflow. Bekijk de oplossingen van Salesforce voor de detailhandel en consumentengoederen.