Spotted at #TC18 Devs on Stage: Vector maps, a redesigned mobile app, parameter and set actions, and Sasquatch


Update: These features are now available! Check out the latest release of Tableau.
Nobody loves giving our community a look at what’s coming next more than the rockstar developers building the features themselves. During this year's Devs on Stage keynote, we heard from Amanda Luthy, Alex Vertin, Swati Srivastav, Keshia Rose, and Denny Bromley, sharing exciting updates from our 2019.1 beta (available now!) and upcoming product releases. Check out some of our favorite highlights.

Power up and share amazing dashboards
Amanda Luthy, visual analytics tester, is an avid outdoorswoman and Sasquatch enthusiast. She combined two of her favorite things—data and dirt—to help her backpacking group plan its next trip and show off new dashboard functionality.

- Vector maps and map styles (coming in 2019) — Maps are incredibly important visual analytics tools. To offer more detail and responsiveness, we’re updating our background map technology to use vector tiles. Amanda showed us how fast and fluid vector maps are, zooming in on different areas of interest to demonstrate how smoothly map features scale—like contours and building footprints. Additional map layers, including satellite images, will bring more context to your data.
- Navigation buttons (Tableau 2018.3) — Want to offer a guided experience between dashboards, sheets, and additional resources? Dashboard buttons provide a simple way to navigate from one piece of content to the next, like switching between different sheets, so it’s easier to build dashboard applications.
- Toggle zone visibility (coming in 2019) — Speaking of hiding: Our new toggle button allows you to hide a dashboard zone until it’s needed. This is especially helpful as more filters are added to dashboards. With a button, a single click makes zones, like a series of filters, disappear or reappear. Wax on, wax off—it’s that easy.
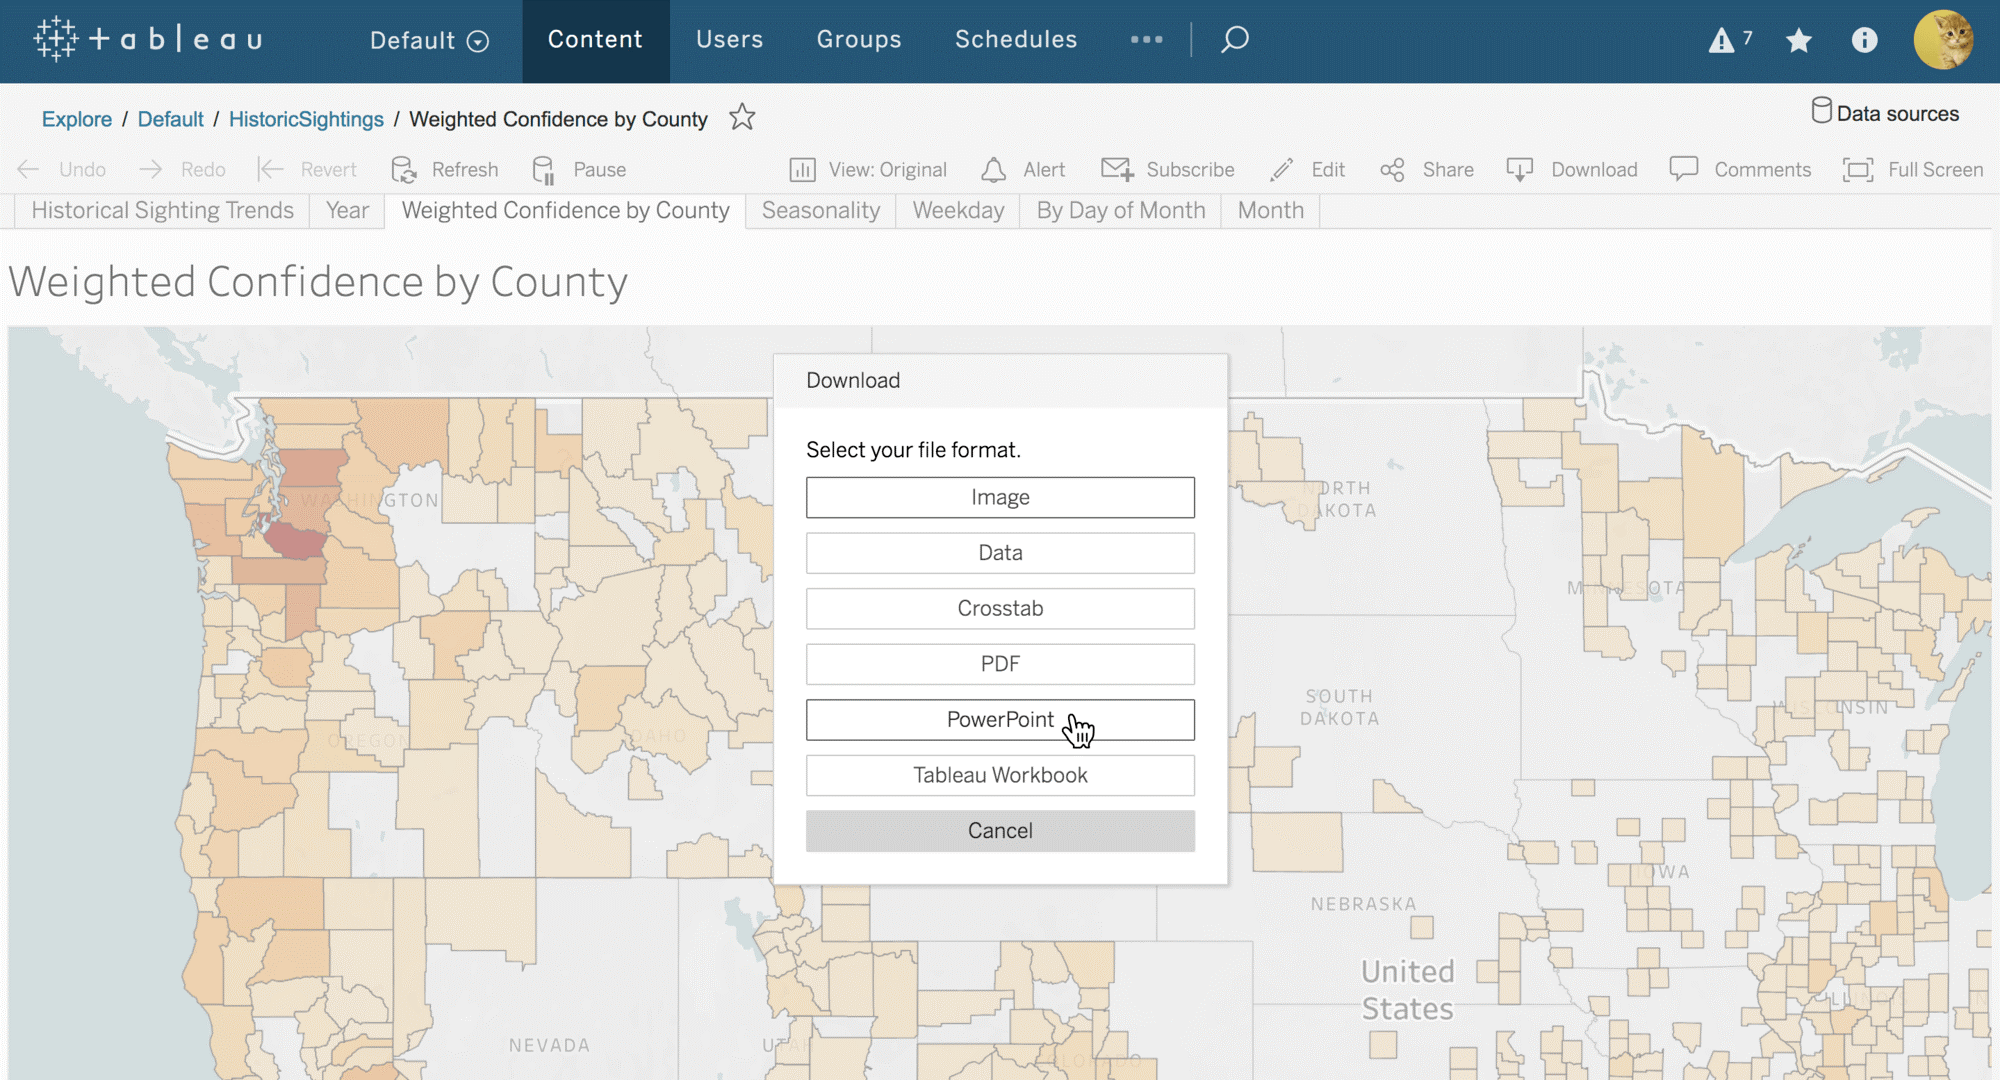
- Export to PowerPoint (Tableau 2019.1 beta) — To support more traditional reporting use cases, we are adding export to PowerPoint. In a few clicks, Amanda’s Sasquatch vizzes were exported into a full deck, ready to take along on her next adventure. Even if you’re not on the hunt for Sasquatch, you can export to PowerPoint to quickly add static images of your vizzes to your important presentations.
Collaborate and get insights anytime, anywhere
Alex Vertin, visual analytics engineer and Sasquatch denier, showed us new ways Tableau enables secure data access—on and offline.

- Redesigned Tableau Mobile app (Tableau 2019.1 beta) — We’re excited to announce a totally redesigned mobile app experience! It’s more secure and easier than ever to use. Users are prompted with new biometric identification (including Touch ID or Face ID) which is easy to enable Server-wide.
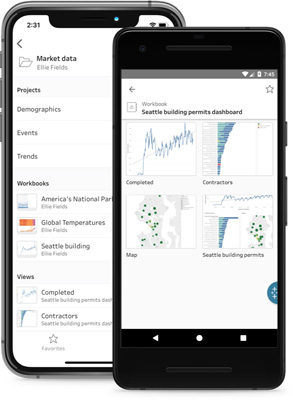
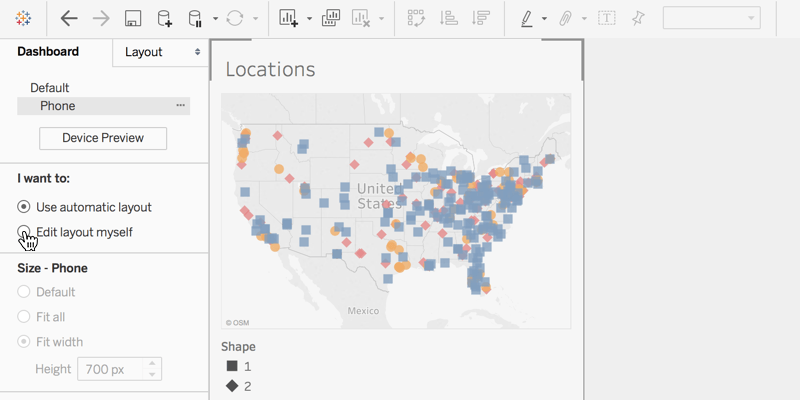
Alex showed us the new browsing experience from the Explore tab, where you can access recent vizzes and explore content within projects. Next, Alex went into airplane mode to demonstrate interactive offline previews, grabbing her rock climbing viz to scroll, highlight, and see tooltips—all without connectivity. - Automatic phone layouts (Tableau 2019.1 beta) — To make your vizzes phone-ready from the get-go, we are bringing you automatic phone layouts. Our smart algorithm makes the best design decisions for a mobile layout so you don't have to. Then, you can customize the layouts if you’d like.
- Tableau Public attribution (Coming in early 2019) — We heard from our community that you want to cite sources of inspiration for new masterpieces on Tableau Public. And now you can! Inspired by a viz about Sasquatch (the music festival), Alex showed us the new Tableau Public attribution feature that links to a source viz and its author’s profile.
Get from secure data to analysis even faster
When not geeking out on data, senior software engineer Swati Srivastav loves to paint, and likens using paint to bring out a subject in her images to using Tableau to bring out insights from data. She showed us a few ways to get to insight faster with new features.

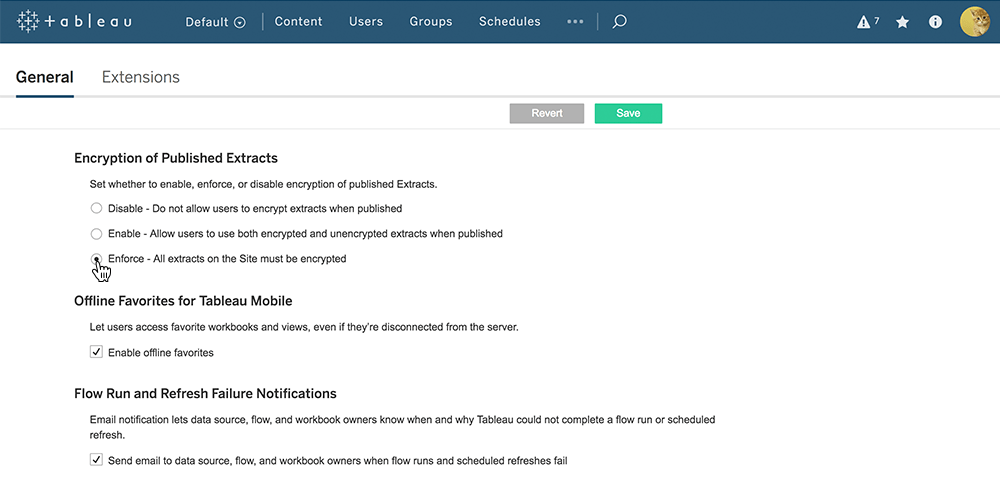
- Encryption at rest for extracts (coming in 2019) — Add an additional level of security with a click of a mouse. Swati showed how we’re improving data security by adding encryption at rest for extracts. Coming soon, extracts will be encrypted while they are stored on disk on Tableau Server. You can delegate the choice of encryption to data publishers or enforce encryption for all extracts across a site.
- Multiple table storage for extracts (Tableau 2018.3) — Using multiple table storage for extracts, Swati showed us faster extract creation and viz rendering times for an impressive Van Gogh Starry Night viz. When creating an extract, you can now choose to mirror the table structure of the data source within the extract, rather than storing the data as a single table within a Tableau Data Extract. With multiple table storage, Tableau only queries the tables it needs in the extract.
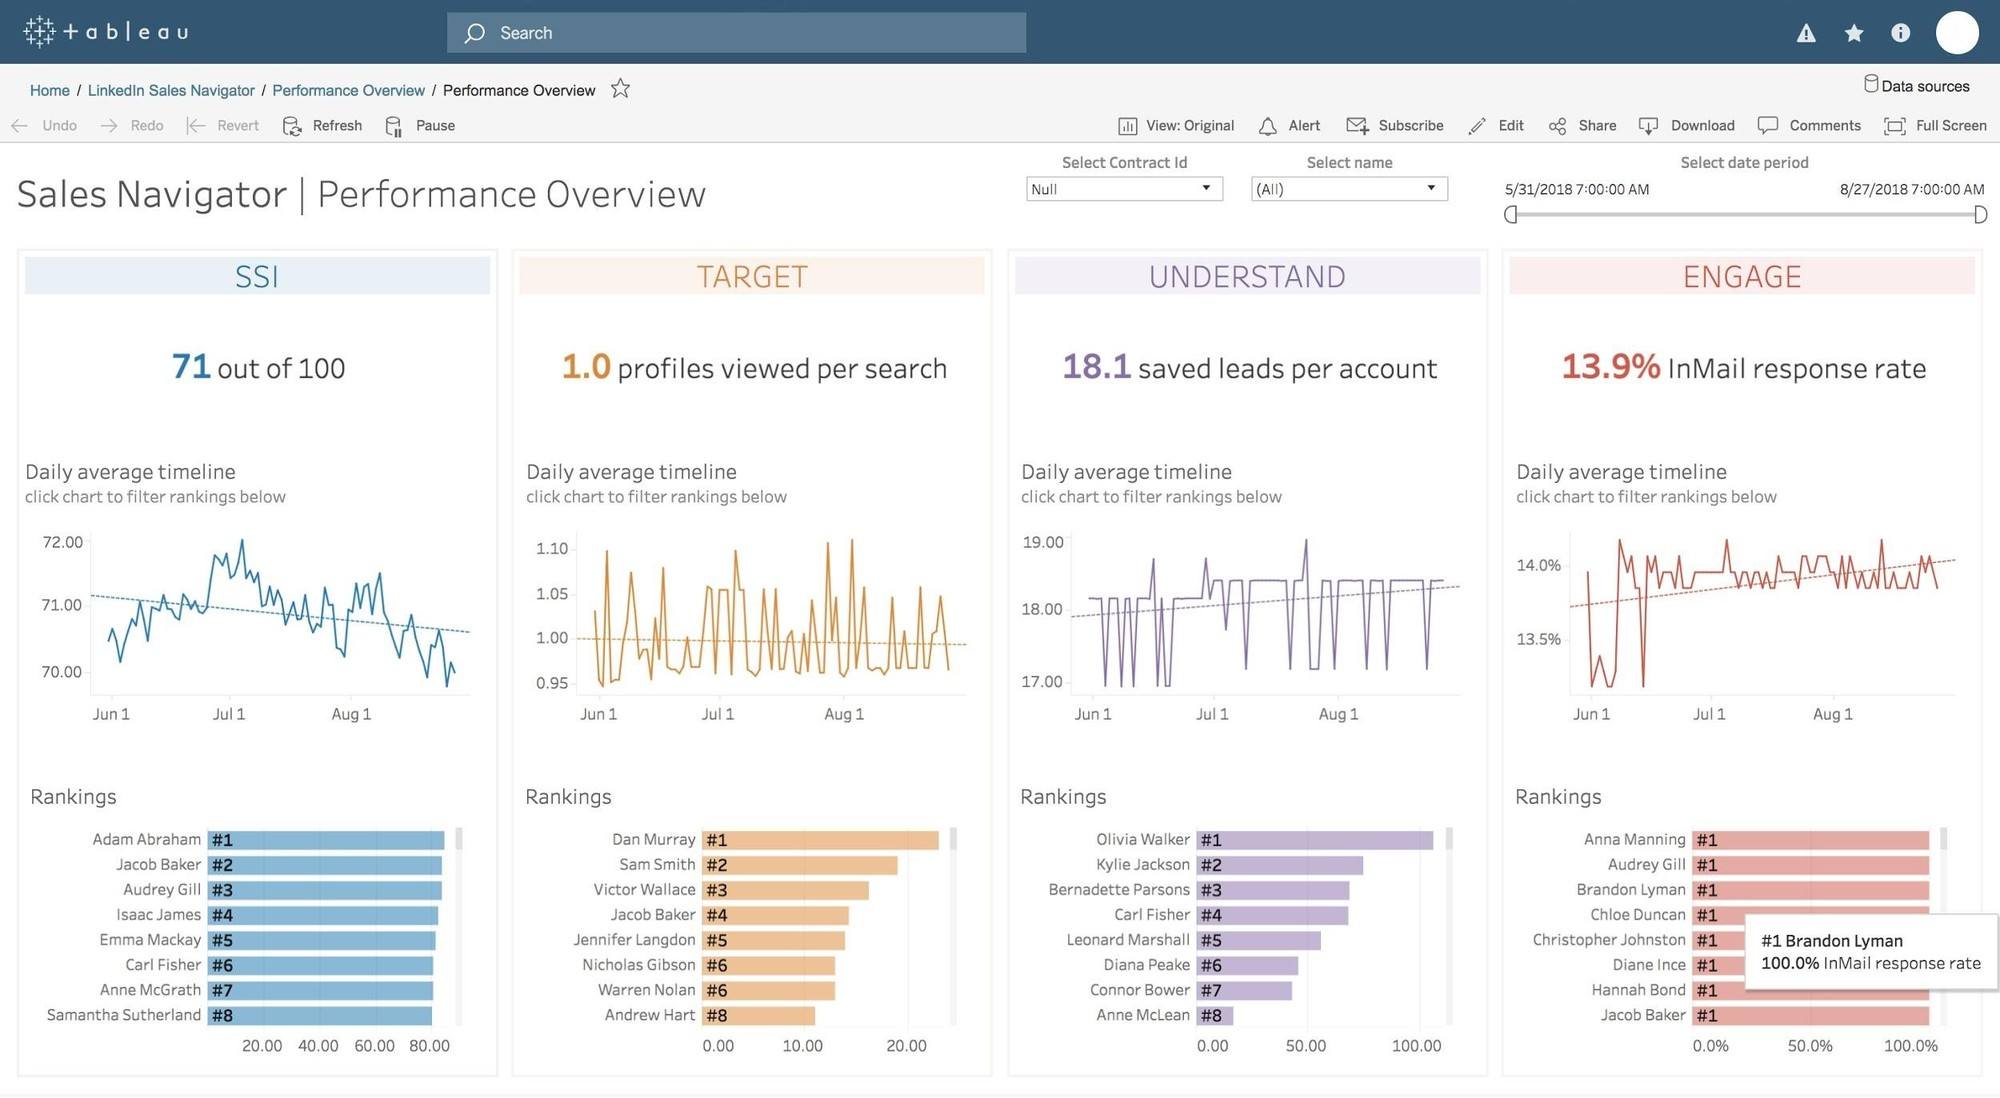
- Dashboard Starter for LinkedIn Sales Navigator (Coming in 2019) — The fastest way to go from data to dashboard with Tableau Online is with Dashboard Starters. And we are adding five new dashboards with our new LinkedIn Sales Navigator Dashboard Starter. The out-of-the-box dashboards are a great starting point to insights, that you can add to or customize.
Extend and customize Tableau with greater flexibility
A product manager on the developer platform team, Keshia Rose loves to help people unleash their creativity. Following yesterday’s announcement of the Tableau Developer Program, she was thrilled to share some of the ways we’re empowering our developer community.

- Webhooks (in Developer preview now) — We want to empower developers to stay on top of events in Tableau Server and Online, so we are introducing support for Webhooks! Keshia used Webhooks to configure server notifications to create a ticket in ServiceNow when a password change caused an extract failure. She also generated a notification in Slack to alert her team when a new dashboard was published in one of their favorite projects. With Webhooks, the customization possibilities are endless, and you’ll never miss an event again.
- Show and hide for the Extensions API (coming in 2019) — We’re adding the ability to show and hide dashboard extensions to our extensions API. Keshia showed a great example of an extension that allows you write back to an inventory management system. The write-back zone is hidden until needed, so it doesn’t take up valuable space in the dashboard.
- Extensions gallery (Tableau 2018.2) — In August, we launched dashboard extensions, empowering developers to build custom applications for Tableau. Our growing Extensions Gallery is the place to find new extensions to give your dashboards superpowers. Keshia showed us some extensions in the works, like one that brings DataRobot machine learning models right into Tableau to help you identify key factors.
Analyze with more powerful, visual interactivity
Senior software engineer Denny Bromley fell in love with Tableau at a former job where he used computational chemistry to discover new cancer drugs. Now he’s excited to see the creativity of the community unleashed on some new features that act as analytical building blocks, bringing interactive, visual analysis to life in new ways.

- Parameter actions (coming in 2019) — Parameter actions place a selected mark’s value into the parameter, updating any vizzes and calculations that use that parameter to drive interactive visualizations. Denny showed us a practical application with a time series comparison, making a year-over-year analysis simple and interactive. With a data set on smoking rates across the US, he also demonstrated how selecting a mark for his home state of Alaska in 2010 adjusted the reference lines across the sparklines for every other state. Parameter actions make visual, quantitative comparison much easier and faster—and that’s just one of the many ways this new feature can be used!
- Set actions (Tableau 2018.3) — While a parameter holds a single value, sets hold multiple values. With set actions, you can change the members of a set with clicks, driving both vizzes and calculations to respond instantly with a selection. One application for this feature is proportional brushing. Another, as Denny showed us with stock data, allows Tableau to do easy point-in-time comparisons.
With each click, the set updated and the Tableau calculation engine took care of the rest. Set actions make table calcs, reference lines, and custom SQL all interactive—and we can’t wait to see what else you’ll do with them!
Thank you—we can’t do this without you!
We are incredibly grateful for the passionate Tableau Community. Your valuable feedback directly influences the features we release, because you continuously find more creative and powerful ways to use Tableau than we can imagine. It’s not just our dream, but also our ask of you—take these new developments, go wild with them, and tell us how we can make Tableau better for you by sharing your ideas.
Join the Tableau pre-release community to try out all the features available now in our 2019.1 beta. And in case you missed our other big #TC18 announcements, read our opening keynote recap.

Verwante verhalen

Extend Access to Embedded Tableau Content with On-Demand Access
 22 juli, 2026

The Tableau+ Bundle with Premium AI, Enterprise Capabilities, and Premier Success
 24 juni, 2026

What is Tableau Prep?
 30 april, 2026