Introducing Tableau Public 10.5


Tableau 10.5 is here with some features to help you see and understand your data even better. What can you do with Tableau 10.5? Create engaging interactivity and augmented dashboards with Viz in Tooltip. Better understand power relationships between variables with drag and drop power trendlines. Gain more insight from your geographic data with enhanced geocoding support.
Viz in Tooltip
Viz in Tooltip allows you to place visualizations of your own design into tooltips, revealing them on hover or selection of individual marks. The data in the viz is automatically filtered to the mark you hover on or select, giving you and your users precise views of the pertinent data. Viz in Tooltip is a great way to show a different level of detail, trends over time, or a legend for the main viz.
Creating a viz in tooltip
To get started, simply design a viz in a separate sheet that's intended to go in the tooltip and then associate it with a host sheet through the Edit Tooltip dialog.
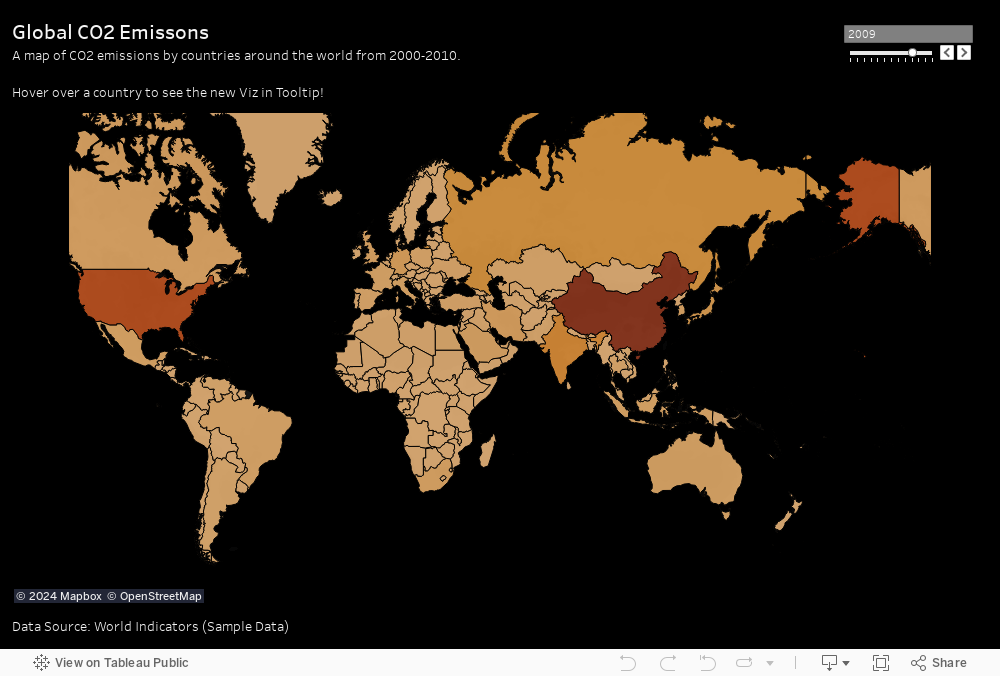
You can download the viz above, then give it a try with your own data! If you make something using Viz in Tooltip, upload it to Tableau Public and share it on social media along with the hashtag #VizinTooltip so others can see what you created.
Analytics at Hyper speed
Hyper is Tableau’s new in-memory data engine technology, designed for fast data ingest and analytical query processing on large or complex data sets. With Hyper at the core of Tableau, you will see faster query response times to stay in the flow of your analysis. This is especially true with calculations like CountD and text field manipulations.
Upgrading is seamless. Simply upgrade to Tableau 10.5 and start using Hyper today! Your existing extracts will be converted to the new .hyper format during a scheduled refresh with Google Sheets, or manual refresh via the desktop client.
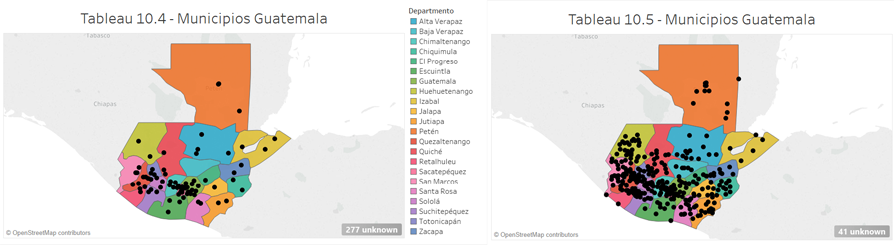
Other great features in Tableau Public 10.5
So what else can Tableau Public 10.5 do? We've added better geocoding support for cities in Southeast Asia, Central America, and South America. Also, US postcodes have been updated with this year's most recent data.
We've also added power trendlines, allowing you to better understand relationships between variables. For example, Kepler's Third Law of planetary motion states that the square of the orbital period of a planet is directly proportional to the cube of the semi-major axis of its orbit. Using some orbital data, you can see Kepler's Third Law in the form of a power trendline in the viz below.

Ready to take your proprietary data to the next level?
We've got you covered! Tableau Desktop and Tableau Online also released version 10.5 that give you these capabilities and more. Download a trial of Tableau Desktop 10.5 to see how you can use the power of Tableau to grow your organization.
We hope you love Tableau Public 10.5 as much as we do, and we're looking forward to seeing what you create with #VizinTooltip!
The Tableau Public Team
Verwante verhalen

Iron Viz 2026: Read Between the Data
 28 mei, 2026

Tableau's Iron Viz Winners

Explore the 2026 Iron Viz Entries
 15 december, 2025