DataFam Roundup: June 2-6, 2025


Welcome! Dig into this week's DataFam Roundup—a weekly blog that brings together community content all in one post. As always, we invite you to send us your content—and the DataFam content from your peers that have inspired you! Find the content submission form here.
Community Highlight
To recognize new and consistent Tableau contributors—we’re excited to have a section within the weekly DataFam Roundup called the Tableau Community Highlight. Find out how to get involved.

Faith Rotich, Analytics Consultant at The Information Lab
London, UK
Faith Rotich is an Analytics Consultant at The Information Lab. She leverages Tableau at work to report on e-commerce website performance, and outside of work, applies it to her personal and community-driven projects. Her journey with Tableau began during a 2023 sabbatical as she explored data visualization as a potential career pivot. She started by visualizing data from topics that genuinely interested her, such as reading habits and birthday distributions. This exploration led her to discover the Tableau community, which she first engaged with at a Tableau User Group. Later, Faith joined The Information Lab's Data School, undertaking four months of hands-on classroom training before transitioning to client work.
Faith particularly values the Tableau community's generosity of knowledge, noting that whenever she encounters a new challenge, she is able to find solutions shared through blogs, YouTube videos, or presentations. This collaborative spirit is also why she enjoys attending Tableau User Groups, participating in community projects, and publishing vizzes on Tableau Public. Faith shares her Tableau expertise through blogging, driven by a desire to pay forward the benefits she gained from others' blogs, and to solidify her own understanding. Looking ahead, she is eager to supplement Tableau with code.
Connect with Faith on Linkedin, X, and Tableau Public.
DataFam Content
- Johan de Groot: The Case for Clearer Parameter Labels in Tableau
- Uday Gundu: From Student to Storyteller: My Journey with Tableau + A Deep Dive into the Future with Tableau Agent
-
Tore Levinsen: TinyTableauTips – Calculated fields #2
-
Steve Adams: Small best practice with big impact
Team Tableau Content
- Agentic Analytics: Why Human Curiosity is Your Ultimate Differentiator
- Visualize, Narrate, Repeat: Closing the Loop on Data Storytelling
Visualizations
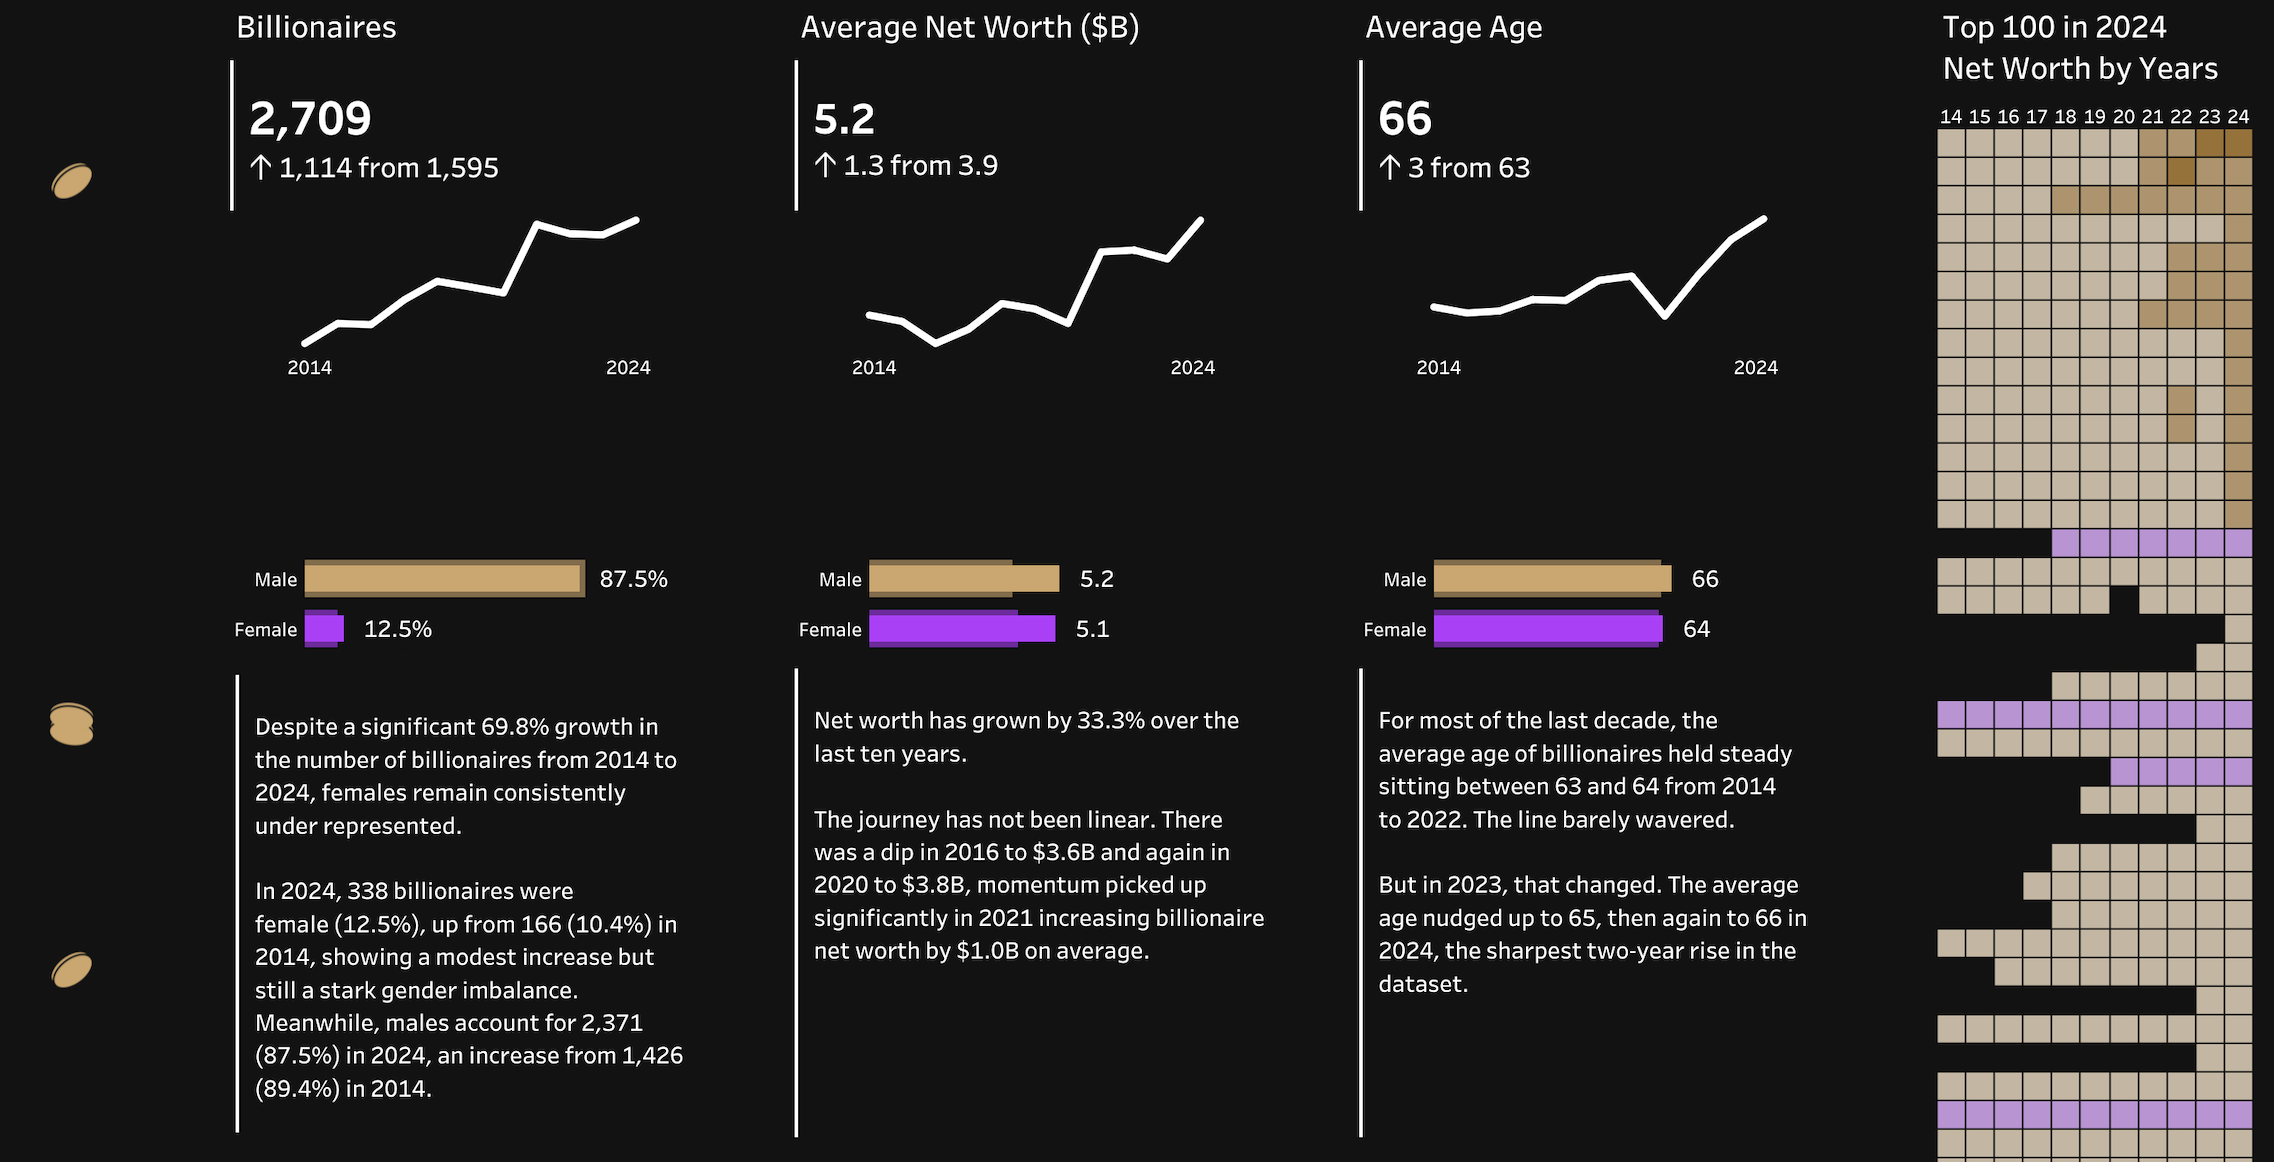
Dub Dub Data: Glow Up - Forbes Billionaires
See the latest Viz of the Day, trending vizzes, featured authors, and more on Tableau Public.
Check out some inspirational vizzes created by the community:
- Danish Sayyed: Survival and Glory - The Everest Story
- Muhammad Muhthadi Choudhury: Visitors to Makkah
- Kat Rocha: Bad Bunny Performance Metrics
- Erik Lineberry: 2025 Week 11 B2VB Pride Events Gantt Chart
- Rob Taylor: A Pride Of Lions
- Natasha Morrison: Interactive Resume
Community Projects
Back 2 Viz Basics
A bi-weekly project helping those who are newer in the community and just starting out with Tableau. Not limited just to newbies!
Web: Back 2 Viz Basics
X: #B2VB
Workout Wednesday
Build your skills with a weekly challenge to re-create an interactive data visualization.
Web: Workout Wednesday
X: #WOW2022
Preppin' Data
A weekly challenge to help you learn to prepare data and use Tableau Prep.
Web: Preppin’ Data
X: #PreppinData
Makeover Monday
Create business dashboards using provided data sets for various industries and departments.
Web: Makeover Monday
X: #MakeoverMonday
Data ChangeMakers
Volunteer to design data visualizations that help nonprofits harness the power of data for social change.
Web: Data ChangeMakers
Visual Climate
Collaborate and share climate data.
Web: Visual Climate
X: #VisualClimate
DataFam Con
A monthly challenge covering pop culture and fandoms.
Web: DataFam Con
X: #DataFamCon
EduVizzers
A monthly project connecting real education data with real people.
Web: Eduvizzers
Games Night Viz
A monthly project focusing on using data from your favorite games.
Web: Games Nights Viz
X: #GamesNightViz
Iron Quest
Practice data sourcing, preparation, and visualization skills in a themed monthly challenge.
Web: Iron Quest
X: #IronQuest
Storytelling with Data
Practice data visualization and storytelling skills by participating in monthly challenges and exercises.
Web: Storytelling with Data
X: #SWDChallenge
Project Health Viz
Uncover new stories by visualizing healthcare data sets provided each month.
Web: Project Health Viz
X: #ProjectHealthViz
Diversity in Data
An initiative centered around diversity, equity & awareness by visualizing provided datasets each month.
Web: Diversity in Data
X: #DiversityinData
Sports Viz Sunday
Create and share data visualizations using rich, sports-themed data sets in a monthly challenge.
Web: Sports Viz Sunday
X: #SportsVizSunday
Real World Fake Data
Create business dashboards using provided data sets for various industries and departments.
Web: Real World Fake Data
X: #RWFD
Data Plus Music
A monthly project visualizing the data behind the music we love!
Web: Data Plus Music
X: #DataPlusMusicCommunity Projects
Verwante verhalen

DataFam Roundup June 2026

DataFam Roundup May 2026

Iron Viz 2026: Read Between the Data
 28 mei, 2026