In its simplest form, data mapping helps a company’s databases talk to each other. In practice, data professionals link attributes and values together between data sources. To illustrate, imagine you have a customer's information living in two different databases. Analysts don’t want their software platforms to count the same customer twice so they create a map that connects Pete Smith in database 1 to Peter Smith in database 2 to avoid future duplication. Data mapping also reduces redundancies and ensures a more accurate analysis so everyone feels confident in the results and insights that are generated. Of course, data mapping is more complicated than the story of Pete Smith. In this guide, we’ll review how data mapping works and explain how it differs from other data projects. Additionally, you’ll learn what’s needed for a data mapping template so you can start the process yourself and get faster answers from your data.
Data mapping’s value in business intelligence
Mapping is a crucial first step to uncover key insights in data analytics and business intelligence. If data pipes into your IT systems uncharted, analysts won’t know what data sources are redundant, if there are systems that exist without IT oversight (sometimes known as shadow data systems), and if some data is putting unnecessary emphasis on outliers and anomalies. Unmapped data might even result in misrepresented analytics results, but all of this can be avoided with intentional governance. With data maps, combining sources into a single, trusted database using consolidation techniques can create clear paths and clean processes for reliable sources of truth. Where do you start?
Choose the right data mapping technique
First, consider which techniques are the most relevant to your circumstances or needs and total cost of ownership for the analytics platform that will perform data integration tasks. There’s a certain level of technical knowledge needed in data mapping, even if some of these techniques do most of the work for you. There’s a range from fully manual to fully automated data mapping techniques, and each has pros and cons.
Manual data mapping
- Benefits: Completely custom to your exact needs, flexible
- Drawbacks: Manual, time-consuming, resource-intensive, tool-agnostic, code-dependent
Manual data mapping requires a heavy lift. It involves connecting data sources and documenting the process using code. Usually, analysts make the map using coding languages like SQL, C++, or Java. Data mappers may use techniques such as Extract, Transform and Load functions (ETLs) to move data between databases. Although, when there are data professionals in an organization who can complete the task, you can create the data map with complete control.
Semi-Automated data mapping
- Benefits: Balance of flexibility and effectiveness
- Drawbacks: Requires coding knowledge, requires navigating between manual and automated processes, resource-intensive
Other companies may use semi-automated data mapping. Semi-automated data mappers use graphical representations of the data links. Pros can create schema maps in a visual interface. For example, users match “StudentName” in one database to “Name” in other databases by drawing lines, using a drag-and-drop function, or smart clustering functionality in software like Tableau Prep. Then there may be an output script with the map in coding language—just like the manual process above. Having a script output to save can assist when you want to standardize your map for other data sources or use cases where you do not have automated tools.
Automated data mapping
- Benefits: Less technical knowledge required, low barrier to entry, fast, easy to scale, easy to schedule, deployment flexibility
- Drawbacks: Training tends to be tool or software-specific, usually required software comes with a price tag
Modern data mapping platforms are evolving to become fully automated. This means anyone—from the data pro to data novice—can complete data mapping without coding to sort data the way they want and refresh the analysis on a regular, scheduled basis to capture all changes. Some mapping platforms now use natural language processing to match data fields and attributes and describe the contents in a data source. This can help teams understand what the data is telling them, reducing incorrect assumptions.
Manage data maps and their complexities
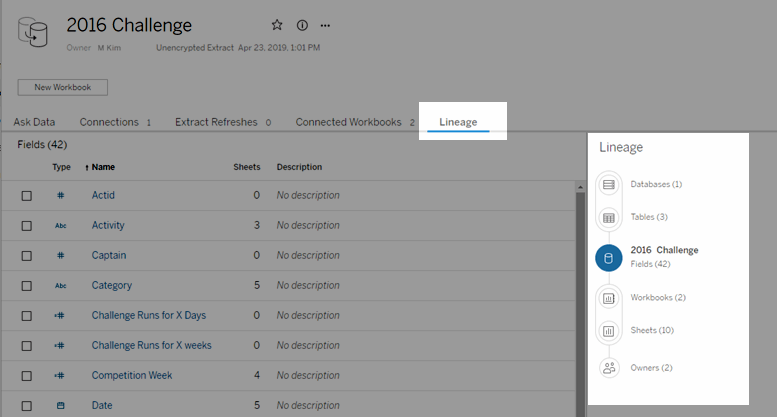
Screenshot of a data lineage in action in Tableau Server
Data maps become complex fast and that poses challenges. For example, maps have to account for the various databases’ metadata and schema before data fields are moved to their final destination. Think about the software programs you have on your machine right now. They have unique ways to store data and have different metadata, which describes their tables and values. Data mappers will need to document and match those components in the data maps. Considering that your company’s stored data will only get larger, you need data management policies that track and facilitate the life cycle—or data lineage—of ingestion, mapping, storing, and analysis. Imagine rearranging your house so that everything is in the best place: the coffee maker is by the light switch, your kitchen appliances are in order of most-used to least-used, and the items you don’t use have been disposed of. Now, imagine a house guest begins moving things around and buying too many redundant pantry items… see where this is going? It’s best not to restart your data mapping every year even though teams may not stick to the data mapping policy. Getting people to follow-through on processes and requirements will be the intensive parts of the project, but with a governed, scalable data analytics platform, it’s possible and easier for everyone to get on board.
How data mapping intersects with data transformation, modeling, and data prep
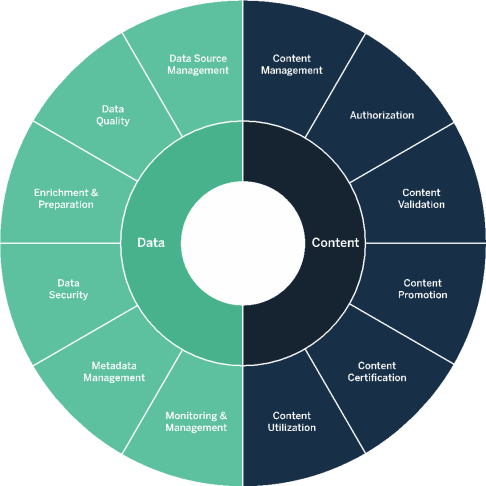
The areas of data and content governance
First, data mapping involves data transformation, such as setting a standard Date format like MM-DD-YYYY for all your databases. Data cleaning like this can be a project itself so it is often counted separate from data mapping. Second, data mapping is considered a phase of data modeling. Data models are the framework of data maps. A data model is like an outer-shell that shapes how data flows through your systems. Data professionals and business stakeholders work together to decide what data models look like. Once they decide on data models, data mapping begins. Analysts or stewards fill in those frameworks with organized data. These data projects are all part of the modern governance workflow.
The intersection between data mapping and data prep
Gif of data being quickly grouped by common characters in Tableau Prep Builder
Data mapping can involve data prep work. Data pros have to ensure the databases are ready before merging them together and mapping them to their final destination. Data prep doesn’t need to be a manual process either. Tableau's Prep Builder helps streamline data cleaning at any coding skill level. Like automated data mapping tools, Prep involves drag-and-drop features in a visual interface but also supports Python and R integrations for advanced techniques and custom code.
What you need for a data mapping template
You may have trouble visualizing what the process of data mapping looks like, but following this simple outline will reveal how values and attributes are matched. Documentation is also very important to maintain your data map over time so here are the required variables to document that will ensure a successful outcome:
- The name of the Source database tables that you will transform or join together
- The name of the Destination or Target database where the information will live after transformation or transfer
- The columns or values of the data tables you are mapping (Name in SourceDatabase, StudentName in TargetDatabase)
- Know the final format of the data after you transform or move it
- What will trigger the data transfer or data integration of the databases
- When and how often automation flows will run, and how to troubleshoot failure
This template can be in a simple spreadsheet to share with others and sets the standard moving forward. Now get started and take this important step in data management to start developing a data culture in your company where all information is accounted for, but not duplicated.