DataFam Roundup September 2025


Welcome! Dig into this month's DataFam Roundup—a monthly blog that brings together community content all in one post. As always, we invite you to send us your content—and the DataFam content from your peers that have inspired you! To send us your content, join the Tableau Community workspace on Slack and join the #community-share channel.
Community Highlight
To recognize new and consistent Tableau contributors—we’re excited to have a section within the monthly DataFam Roundup called the Tableau Community Highlight. Find out how to get involved.
Lara Willson, Analyst, BI Products at The Walt Disney Company
Florida, USA
Lara Willson is a BI Products Analyst at The Walt Disney Company. She first discovered Tableau in an early analyst role when she was tasked with automating reports that were previously built in spreadsheets. With a background in both design and analytics, Lara found Tableau to be the perfect blend of these two worlds. Today, her role focuses on leveraging Tableau to support HR functions, and she also uses it as a creative outlet in her personal time.
Lara is an active member of the Tableau community, where she shares her knowledge on the Tableau Community Slack workspace and LinkedIn and participates in community projects. She credits projects like Workout Wednesday, Back2VizBasics, and Makeover Monday as being instrumental in her development. This year, she is challenging herself to complete every Workout Wednesday and Back2VizBasics challenge.
Connect with Lara on Linkedin, Tableau Public, and the Tableau Community Slack workspace.
DataFam Content
- Blake Feiza: Behind the Build: Sports Radial Calendar
- Dominique Welt and Elie Elia: Teaching Data Preparation to Non-technical Audiences Using Tableau Prep Builder
- Annabelle Rincon and Adam Mico: Semantic Layer in Plain English
- Umar Hassan: How Not to do a BI Reporting Migration Part 2: A Waste of Time
- Johnan de Groot: Add ‘All’ and more options to a Dynamic Parameter
- Fi Crocker: Migrate Tableau Server to Cloud with Automation - Up to 10x Faster
- Matt Huff:
- Deepak Holla:
Team Tableau Content
- Tableau September Release
- Tableau Next Interactive Demo
- Save the Date! DataFam Europe 2 - 3 December 2025
- Add the Tableau Keynote at Dreamforce to your agenda
Visualizations
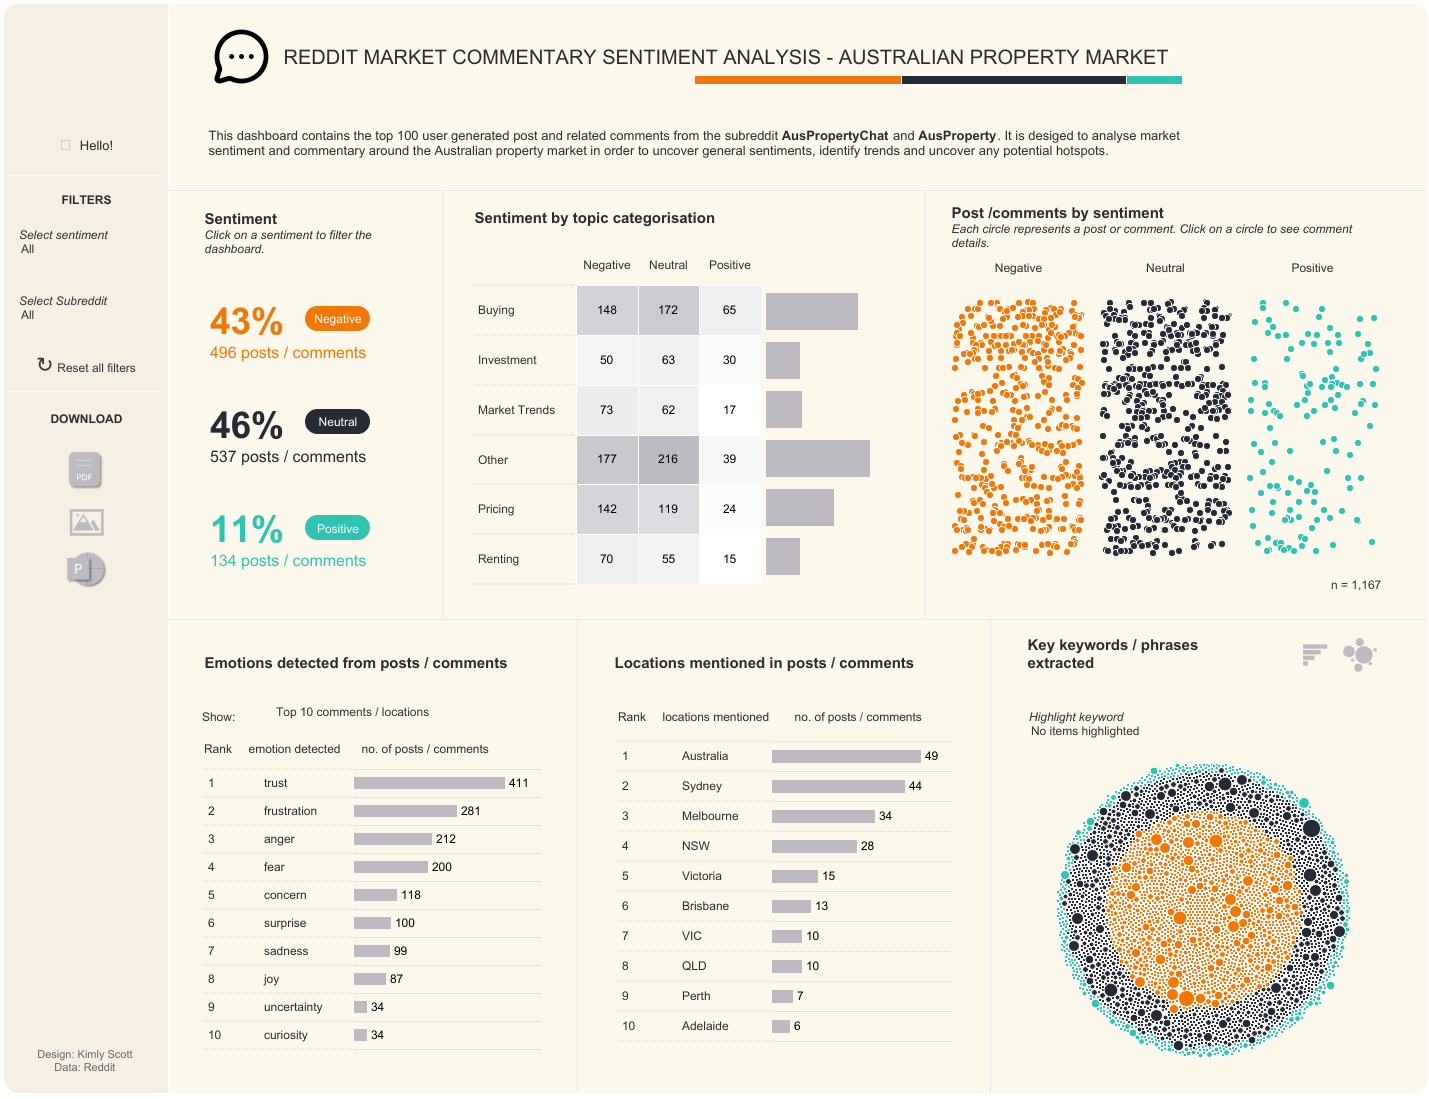
Kimly Scott: Reddit Property Market Sentiment Analysis
See the latest Viz of the Day, trending vizzes, featured authors, and more on Tableau Public.
Check out some inspirational vizzes created by the community:
- Lilla Rasztik: The Most Spirited Process: From Botanicals to the Bottle
- Chie Sakaki: Final Heat: Every Pitch Told a Story
- Fiona Crocker: RWFD Social Media - Dub Dub Data
- Matthias Giger: Resolved Issues with Tableau Desktop, Prep, and Server
- Jinseong Heo: Nexon Icons Match Line-up Dashboard
- Marco Motta: National Surveillance Data Dashboard
- Rushikesh Bedre: Tesla Social Sentiment Command Center
- Miles Crow: Healthcare Provider Look-Up
Community Projects
Back 2 Viz Basics
A bi-weekly project helping those who are newer in the community and just starting out with Tableau. Not limited just to newbies!
Web: Back 2 Viz Basics
X: #B2VB
Workout Wednesday
Build your skills with a weekly challenge to re-create an interactive data visualization.
Web: Workout Wednesday
X: #WOW2022
Preppin' Data
A weekly challenge to help you learn to prepare data and use Tableau Prep.
Web: Preppin’ Data
X: #PreppinData
Makeover Monday
Create business dashboards using provided data sets for various industries and departments.
Web: Makeover Monday
X: #MakeoverMonday
Data ChangeMakers
Volunteer to design data visualizations that help nonprofits harness the power of data for social change.
Web: Data ChangeMakers
Visual Climate
Collaborate and share climate data.
Web: Visual Climate
X: #VisualClimate
DataFam Con
A monthly challenge covering pop culture and fandoms.
Web: DataFam Con
X: #DataFamCon
EduVizzers
A monthly project connecting real education data with real people.
Web: Eduvizzers
Games Night Viz
A monthly project focusing on using data from your favorite games.
Web: Games Nights Viz
X: #GamesNightViz
Iron Quest
Practice data sourcing, preparation, and visualization skills in a themed monthly challenge.
Web: Iron Quest
X: #IronQuest
Storytelling with Data
Practice data visualization and storytelling skills by participating in monthly challenges and exercises.
Web: Storytelling with Data
X: #SWDChallenge
Project Health Viz
Uncover new stories by visualizing healthcare data sets provided each month.
Web: Project Health Viz
X: #ProjectHealthViz
Diversity in Data
An initiative centered around diversity, equity & awareness by visualizing provided datasets each month.
Web: Diversity in Data
X: #DiversityinData
Sports Viz Sunday
Create and share data visualizations using rich, sports-themed data sets in a monthly challenge.
Web: Sports Viz Sunday
X: #SportsVizSunday
Real World Fake Data
Create business dashboards using provided data sets for various industries and departments.
Web: Real World Fake Data
X: #RWFD
Data Plus Music
A monthly project visualizing the data behind the music we love!
Web: Data Plus Music
X: #DataPlusMusic
BizViz52
A weekly project centered around designing business dashboards.
Web: BizViz52
X: #BizViz52
関連ストーリー

DataFam Roundup June 2026

DataFam Roundup May 2026

Iron Viz 2026: Read Between the Data
 2026/05/28