Maps in Tableau 9.3: More data, easier interaction, and a few surprises, too


You often ask us to build more data into Tableau maps, and we do hear you. With every Tableau release, we add more data to build out global coverage for common administrative boundaries and cities. And with Tableau 9.3 comes loads of new data and some important updates to existing data.
The biggest news is that we’ve added postal code data for 39 countries that were previously not supported. And you can now use filled maps for all of the 42 countries that are shipped. Here is a glimpse of the new coverage map.
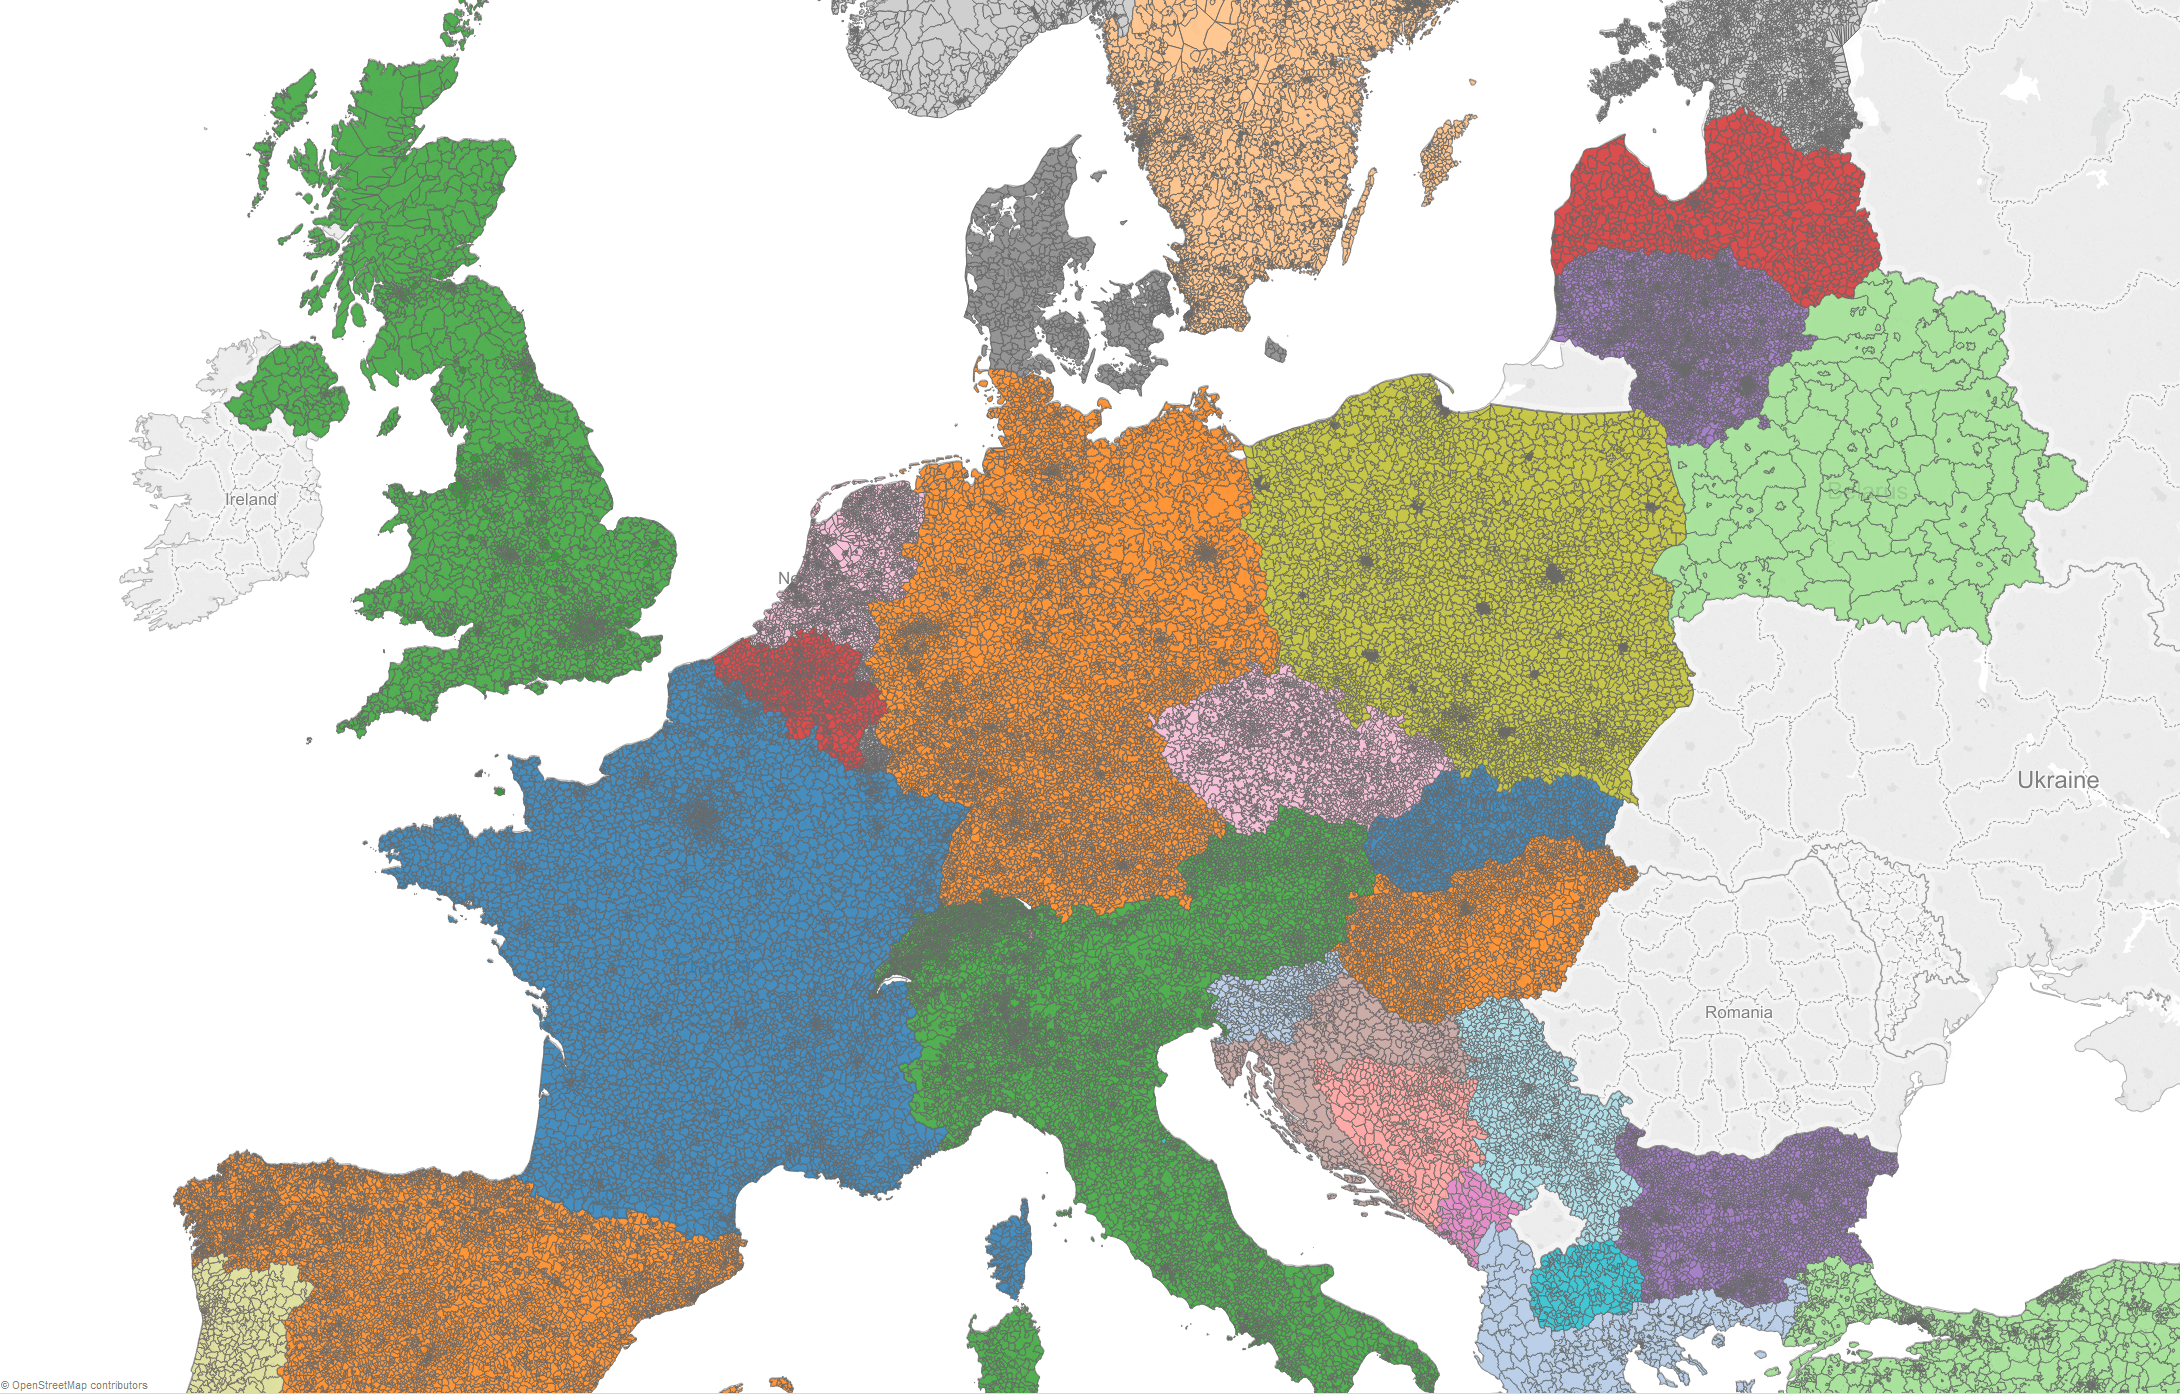
European postal codes in Tableau 9.3: Albania, Andorra, Austria, Belarus, Belgium, Bosnia and Herzegovina, Bulgaria, Croatia, Cyprus, Czech Republic, Denmark, Estonia, Finland, Former Yugoslav Republic of Macedonia, France, Germany, Gibraltar, Greece, Hungary, Iceland, Italy, Latvia, Liechtenstein, Lithuania, Luxembourg, Malta, Monaco, Montenegro, Netherlands, Norway, Poland, Portugal, San Marino, Serbia, Slovakia, Slovenia, Spain, Sweden, Switzerland, Turkey, United Kingdom, and last but not least, the lone postal code of Vatican City.
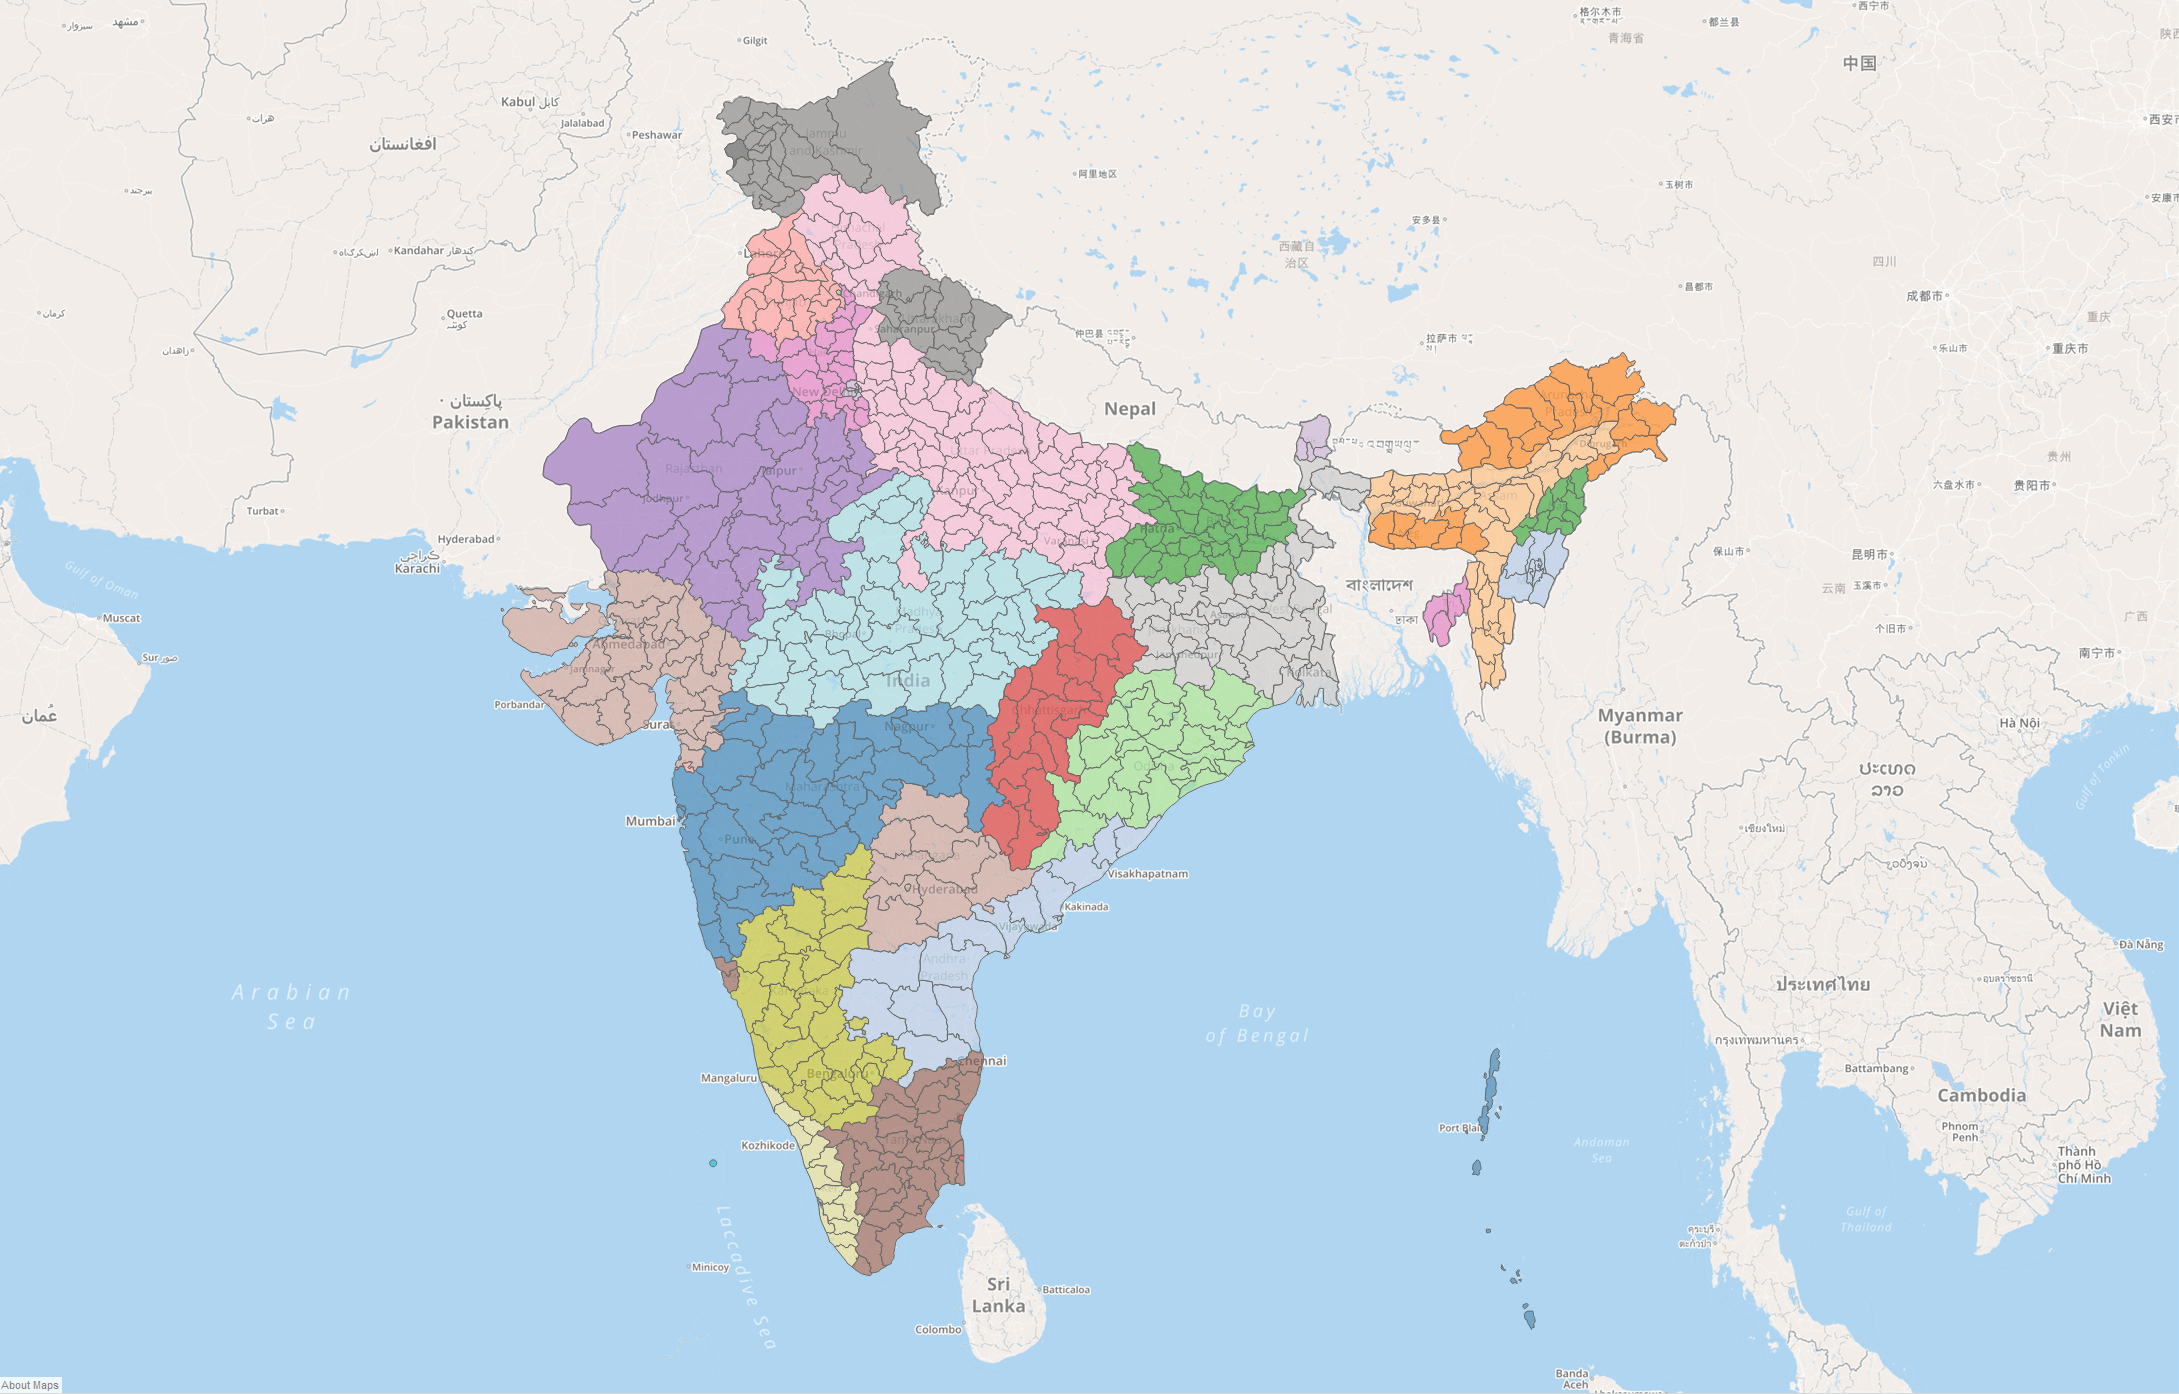
And that’s not all. In Tableau 9.3, we’ve added Indian districts.
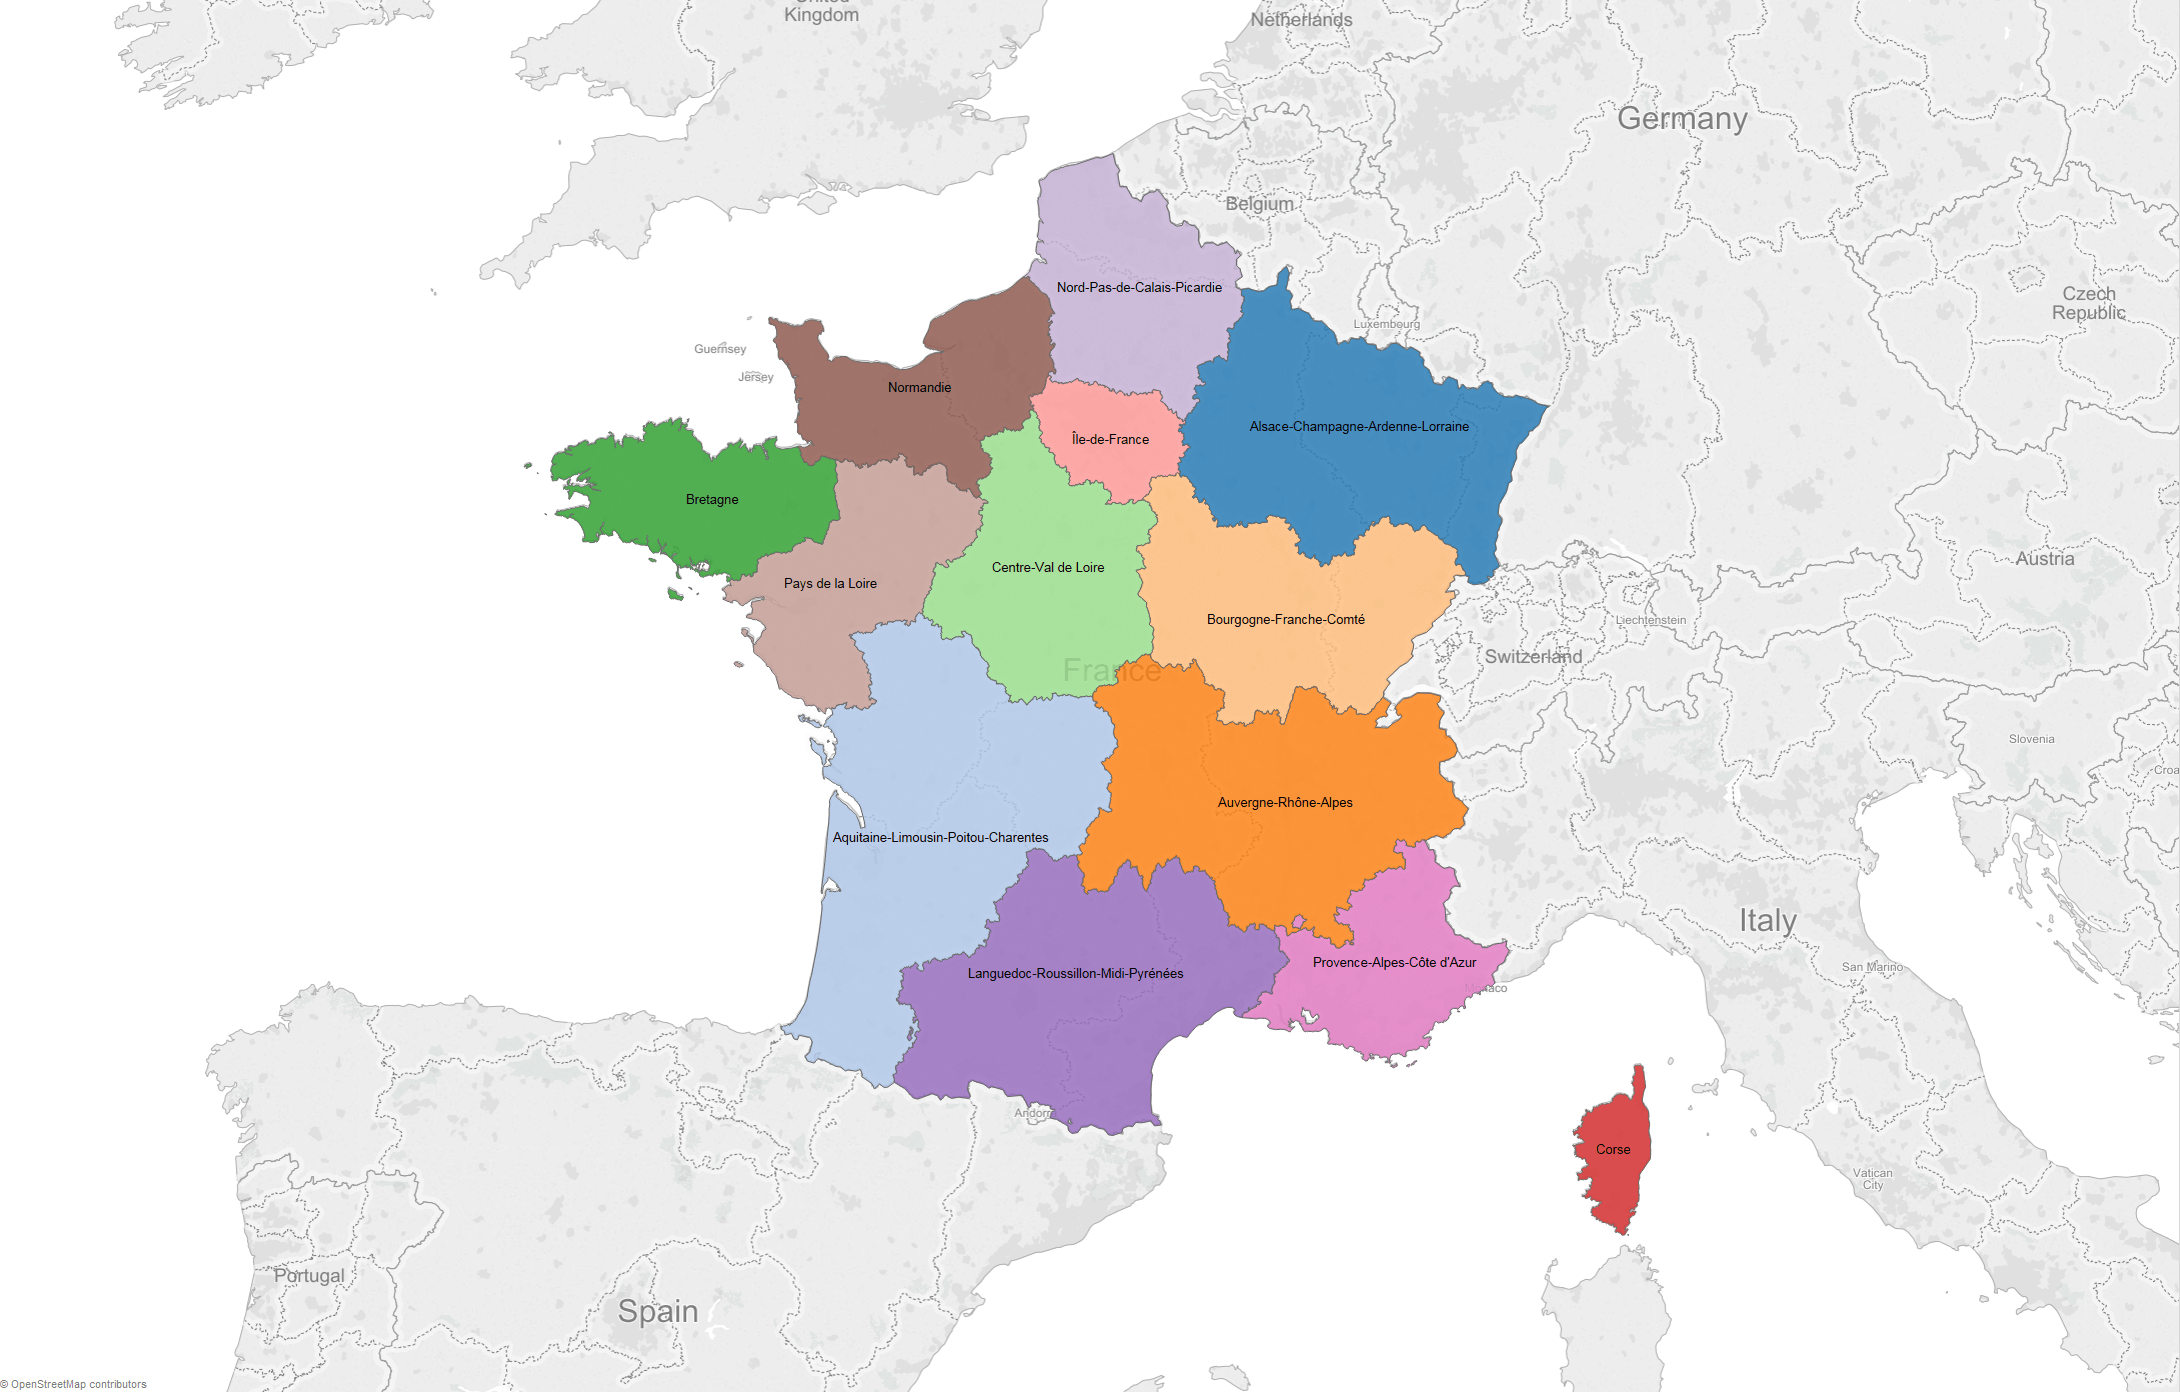
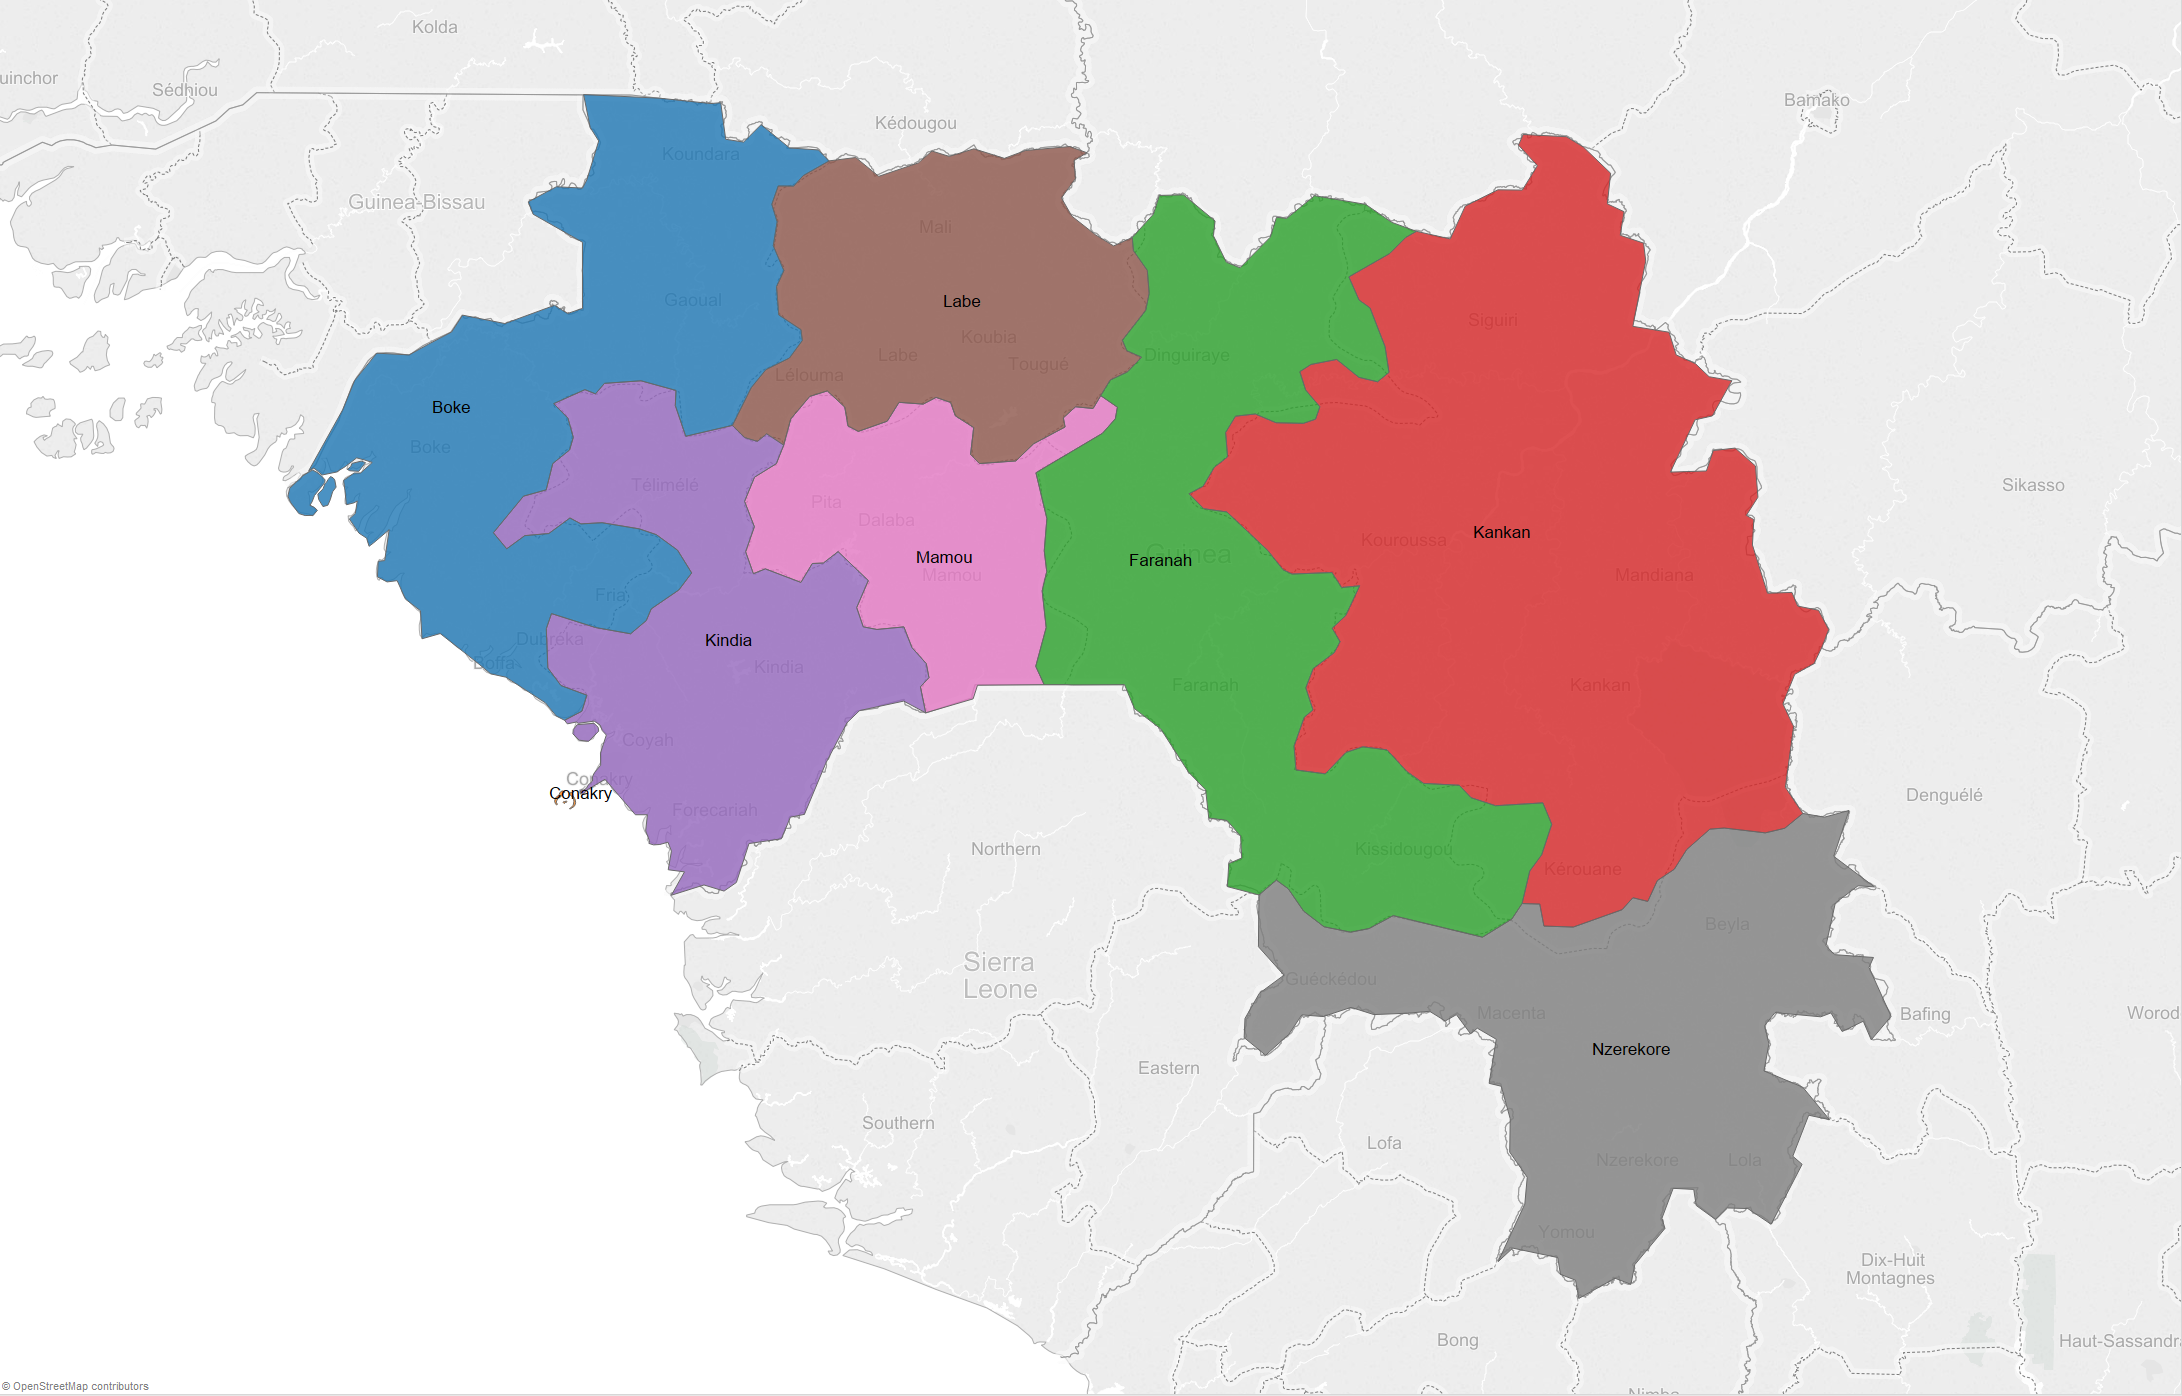
We’ve also updated the French regions caused by recent territorial reform as well as regions in Guinea.
For the US, we’ve updated zip codes and demographic data layers.
For those of you who know about the inner-workings of Tableau’s geocoding capabilities, you might be wondering about geocoding performance with all of this data being added. Surprise! We actually made geocoding faster in many cases.
Our maps improvements did not end with these data updates and additions. We’ve enhanced the experience for interacting with your maps. Ladies and gentlemen, children of all ages, it’s now easier to zoom in Tableau. Let me explain.
If you use a mouse with a scroll wheel or a trackpad that supports touch gestures, you can now zoom in and out on a map without holding a modifier key. It just works! But that’s not all. When performing this type of interactive zooming, the zoom will now be targeted at the position of your cursor, making your navigation experience much more predictable.
Tableau 9.3 also comes with changes to the way tools work. The new (should I say returning?) default tool for maps is rectangular selection. When you switch to other tools like pan or radial selection, they will remain active after use. We call this “sticky” behavior and it puts you in control of how your interactions work.
Perhaps the most significant improvement with respect to tools is that Tableau will store the last active tool used with the worksheet. Now, when you publish your workbook to your company’s server or post your analysis on Tableau Public, you can author the initial interaction with your viz.
For those of you using WMS to serve background maps in Tableau, this next enhancement is for you. Surprise! Your map is no longer squished! In Tableau 9.3, if your WMS supports Web Mercator, we will use it. For those of you making maps of areas that are far from the equator, try it out!
We can’t talk about background maps without looking at the success of the Mapbox integration released as part of Tableau 9.2. In Tableau 9.3, we’ve extended the support for Mapbox maps to include maps built using Mapbox GL. What does this mean? Any map you have built with Mapbox, you will be able to use in Tableau, whether you’re using the new Mapbox Studio or the old Studio Classic (read more about Tableau + Mapbox).

Please send us your feedback by posting in the comments below or on the Community Ideas Forum.
Now, go forth and make beautiful maps!
Tableau 9.3 feature blogs
Tableau 9.3 Has Arrived
We Sweat the Small Stuff in Tableau 9.3
In Tableau 9.3, Start Interacting with Your Dashboard While It Loads
Stay in the Flow with Tableau Online 9.3
Publishing Data Sources Just Got Easier in Tableau 9.3
Stay Connected with Auto Sign-In in Tableau 9.3
Say Hello to Versioning in Tableau 9.3
Dude, Where's My Workbook?
Introducing Initial SQL with Parameters in Tableau 9.3
See the New Server Management Tools in Tableau 9.3
Combine Your Data with Union in Tableau 9.3
Tableau 9.3 Beta Is Here
We’d like to extend a huge thank you to all the beta testers who tried Tableau 9.3 beta. If you’d like to be involved in future beta programs, let us know at beta@tableau.com.
Download Tableau 9.3 today.
Storie correlate

Extend Access to Embedded Tableau Content with On-Demand Access
 22 Luglio, 2026

The Tableau+ Bundle with Premium AI, Enterprise Capabilities, and Premier Success
 24 Giugno, 2026

What is Tableau Prep?
 30 Aprile, 2026