How to mimic the magic of LOD expressions in Tableau Prep


Editor's note: A version of today’s Tableau Prep tip originally appeared on Webranz Senior Consultant, Alexander Waleczek’s blog, Curvediscussion. Tableau Prep helps everyone quickly and confidently combine, shape, and clean their data for analysis. Learn more about Tableau Prep or try it for free.
Tableau Prep supports the same calculations as Tableau Desktop, empowering you to flesh out the data set as needed for your analysis. However, not all calculation types are possible in Tableau Prep: Table Calculations and INCLUDE or EXCLUDE Level of Detail expressions are all dependent on the visualization, so they don’t occur in the data prep process.
However, it's easy to generate identical results to a FIXED LOD expression in Tableau Prep, and I’ve created a sample workflow below to show you how to do it yourself. For those already familiar with LOD expressions, you can skip ahead to the step-by-step instructions.
What is a Level of Detail (LOD) expression?
Level of Detail (LOD) expressions allow you to analyze data and answer questions involving multiple levels of granularity. The level of detail in your analysis is usually determined by the structure of the visualization. For example, if you're looking at monthly sales, your LOD is month. If you're looking at monthly sales per country, your LOD is month and country.
Using Level of Detail expressions allows you to perform analysis and create visualizations outside of the level of detail in the view—like if you want to compare per-month sales with your overall sales.
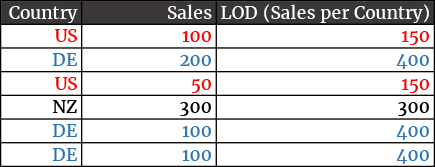
As an example, the table below contains sales information for three countries. Both the US and Germany have multiple rows of sales information. The Level of Detail expression (Sales per Country) provides the total sales for a given country across every row—so we see that the US has a total sales number of 150, whether we're looking at the row for 100 or 50. In Tableau Desktop, the calculation would be written as {FIXED [Country] : SUM([Sales])}.
For those just starting out with LOD expressions, I recommend Andy Kriebel’s post around FIXED Level of Detail expressions in a plain English sentence.
How to generate the results of a FIXED LOD expression in Tableau Prep
Since you can't write an LOD expression in Tableau Prep, we need to do it in a few stages:
- Bring your data into the flow with an input step: Don’t change the level of detail or filter anything out.
- Calculate the aggregate values to supplement the full data: In this case, sum of Sales per Country.
- Combine the two data sets into one: This adds a new, aggregated column to the original file.
To follow along with this workflow, download a free trial of Tableau Prep and connect to the sample Superstore data files located here:
(Windows) C:\Program Files\Tableau\Tableau Prep
(Mac) /Applications/Tableau Prep
1. Bring your data into the flow with an input step
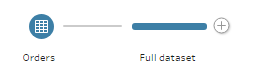
First connect to the data set. For this example, I’m using the Tableau-provided sample data set, Superstore. Drag the Orders table to the canvas, creating an Input step in the flow. Then add a new step after the Input step.
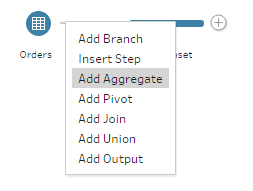
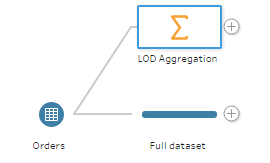
Next, we will branch our flow, allowing us to create the aggregated values, and at the same time, maintain our original data set. Our intention is to create two separate copies of the data that we can manipulate independently. This allows us to do the aggregation on one path and keep the full data set on another. Later, we can join them back together to have the original data as well as the FIXED, aggregated data.
Make sure you add the Aggregate step in a new branch from the Input step, not after the Clean step we just inserted.
2. Calculate the aggregate values to supplement the full data
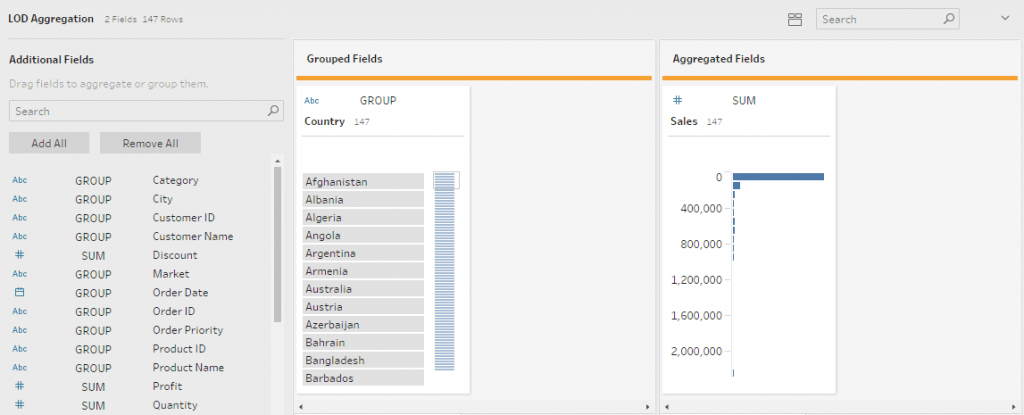
The image below shows how we set up the fields in the aggregation step.
In an LOD expression, the dimension declaration (the portion after the keyword and before the colon) is handled in Tableau Prep by the "Grouped Fields" area in the left pane. An LOD's aggregate expression (everything after the colon) is handled by the "Aggregated Fields" area in the right pane.
Therefore, since we want the sum of sales per country, we bring the field from the dimension declaration (Country), to the Grouped Fields area in the left pane and the field from the aggregate expression (Sales) to the Aggregated Fields in the right pane. And verify the aggregation being applied is sum.
The result of this action is a data set that has one record per country with the total sales for this country. At this point, we will rename our aggregated field to “LOD Sum per Country” to make it easier to identify later on.
3. Combine the two data sets into one
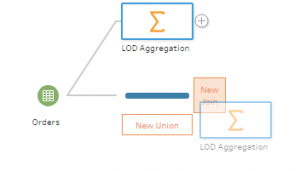
Now we need to bring the two steps together again. It is tempting to click on the little “+” next to either of the steps and add a join, but Tableau Prep has a nice little feature where you can drag and drop elements to connect them.
In this case, drag your Aggregate step down to your first step until you see the orange drop areas and release it on top of “New Join” (NOT New Union).
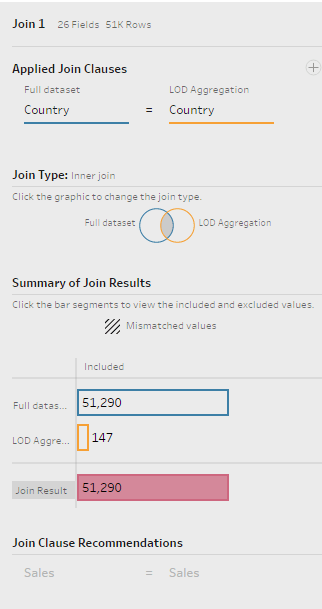
If you look in the configuration, you will see something similar to the screenshot below. Tableau Prep should detect that you want to join on Country (after all, it’s the only dimension in your second data set).
You will also notice that the total number of records in the full data set equals the join result; we didn’t filter anything or change the level of detail for our main data set, so this is what we want to see. If these numbers are different, it is an indication that something went wrong.
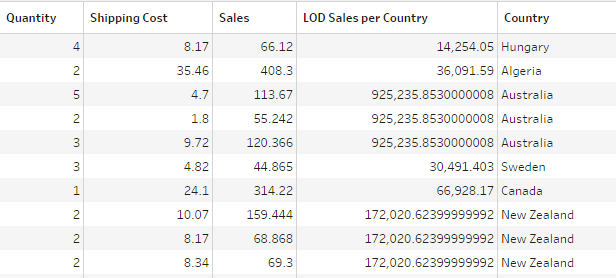
If we look at the data grid in Tableau Prep, we can now see something similar to the initial table on the top of this post. Every country has their record-level sales in one column and the sum of all sales for that country in a second column. The sum of sales is the same for each record for a given country.
Note: In the image below, it doesn’t add up correctly because there is a lot more data which doesn’t appear in the screenshot.
If your data is now fully prepped and ready for analysis, simply add an output step and run the flow to generate the new data set.
Now how do I use it?
Now that you’ve built out your LOD expression, you can use it in a variety of ways:
- Share it with others: You can run the flow and output the data as a CSV or Tableau extract, with the option to save it locally or publish on Tableau Server to share with others.
- Use it as a base for other calculations: You can use the LOD expressions for several use cases—here’s the top 15 LOD use cases. For example, you can calculate the percent of total sales each country contributes. You could also prepare churn analysis or use it to calculate how long someone has been a customer and how many orders they make on average per month.
How do I customize it?
As you may know, LOD expressions are very versatile and flexible. We've gone through a very simple example, replicating the calculation {FIXED [Country] : SUM([Sales])}, but we could use this method to perform more complex calculations as well. For example, if we wanted to replicate {FIXED [Country],[State] : SUM([Sales])}, we could do so by adding the State field to the aggregation.
You can adjust this LOD expression to your specific use cases. To customize it, you need to change the level of aggregation in two places.
- In the aggregation tool. Add "State" in the Grouped Fields area.
- In the join step. Make sure that Tableau Prep joins on the new field as well.
Now you have more knowledge of LOD expressions AND Tableau Prep! To see what people are saying (and sharing) around Tableau Prep, follow the Tableau Community.
Learn more Tableau Prep skills:
- Try Tableau Prep for free
- Become a data prep master with free training videos or instructor-led training
- Learn the best practices for tidy data using Tableau Prep
- Find more Tableau Prep resources in the Tableau Community
Storie correlate

VizQL Data Service from Tableau: Use Your Data, Your Way
 8 Agosto, 2024

When and How to Use Multi-fact Relationships in Tableau
 1 Agosto, 2024

Top data books of 2021
 12 Dicembre, 2021