Zainab Ayodimeji’s Tableau Journey


Since the platform was founded in 2010, millions of people have used Tableau Public to develop their data visualization skills, find inspiration, and connect with like-minded data enthusiasts from around the world. While we’re thrilled to be celebrating this milestone, we also want to acknowledge the accomplishments of those in the Tableau Community, like Zainab Ayodimeji.
Zainab comes from an engineering background with a bachelor’s degree in Agricultural & Biosystems Engineering and master’s degree in Advanced Mechanical engineering with Management. She picked up an interest in data during her masters degree, landed her first data role right after and has not looked back since. She recently moved to Sweden where she helps turn business problems into data questions, answering those questions with analytics and visualization. When she is not working or coming up with a new visualization, she enjoys watching food shows, eating, and listening to music.
How long have you been using Tableau?
I got a Tableau account in December 2018 as part of a data analytics course I was taking and this was all I did before abandoning it.
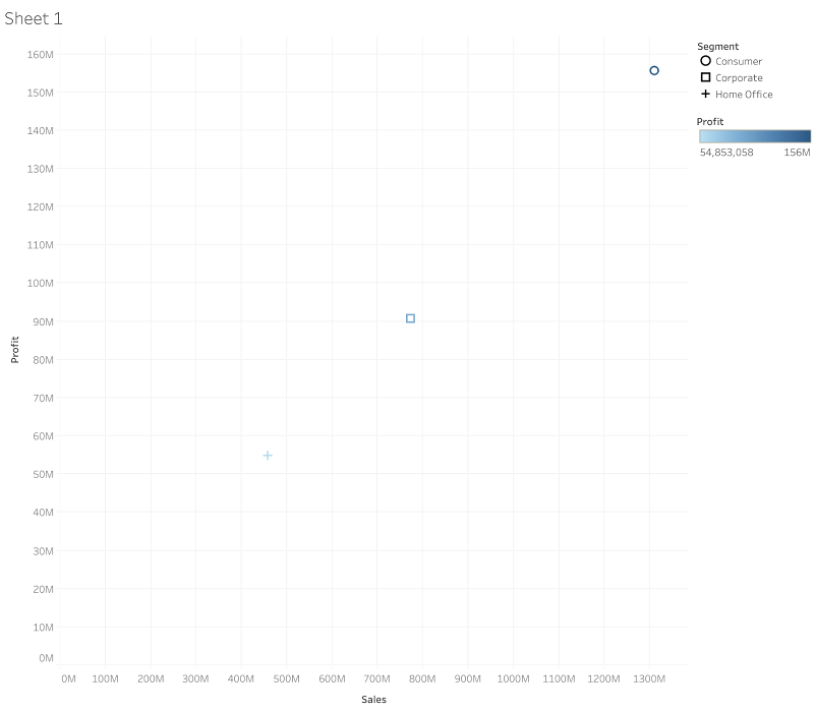
Fast forward to 2019, I joined the first visualization community in Nigeria organised by Tableau Zen Master Abisola Oni where I started to pick more interest in Tableau. I did one or two vizzes. Then the pandemic happened and our meetups went virtual. This allowed people from the global Tableau community to join us. First, it was Ken Flerlage. After his talk, my interest level skyrocketed and I downloaded Tableau Public again. Sarah Bartlett also spoke to us later on in the year. In prep, we we asked to prepare a #MakeoverMonday viz beforehand so she could give feedback after the session. This happened in June 2020 and it was the first time I really took my time to build a viz with Tableau. This is what the output looked like—I was really proud of it.
Sarah gave her feedback and while her feedback was on this particular viz, the indirect effect it had was to open my eyes to the possibilities of Tableau Public. I have participated in #MakeoverMonday every week since then and I have not stopped using Tableau since then.
What role has Tableau Public played in your professional development?
Tableau Public was the enabler to my data visualization journey. It made it possible for me to participate in community challenges, acquire new data visualization skills, and connect me to the #DataFam. My major Tableau Public highlight was having my Travis Scott visualization exhibited in the Tableau Public Viz Gallery.
All of those things created the ripple effect and eventually I landed my dream job at Spotify.
Do you have a favorite topic that you like to viz?
I love to viz about music and social causes like gender equality because I am passionate about these two things. More recently, I am developing an interest in vizzing my personal data like Netflix and Spotify. However, my Tableau Public profile is mostly #MakeoverMonday vizzes because the data is readily available so it is quicker to do.
What role has the #DataFam had on your Tableau journey?
I was introduced to #DataFam by Sarah Bartlett when she gave me a #TableauFF shoutout in June 2020. One thing that instantly stood out to me was how warm and welcoming the community was. The community is also very diverse with people from different backgrounds and experience levels so I have been fortunate to receive constructive feedback from the best of the best. I also learn a lot from the resources they share and events they organise.
Participating in community challenges like #MakeoverMonday by organised by Eva Murray #IronQuest organised by Sarah and #RWFD organised by Mark improved my skills to a great extent. I also appreciate Adam Mico’s efforts to host social community events which I find to be a great way to meet, hangout, and learn more about other people from the community.
Without the community, I don’t think I would be where I am today. In just a year, my skills have dramatically transformed, I have made new friends, and connected with many cool and awesome people around the world.
Do you have a favorite viz or author on Tableau Public?
Whew! Where do I even start?! There are so many cool authors and vizzes on Tableau Public but some of my favourite vizzes include “Emotional valence of the broadway” by Lindsey Poulter, Stormzy by Sarah Bartlett, #VizForSocialGood- Self Reflection 2017 to 2020 by Samuel Parsons, and Escher’s Gallery by Wendy Shija.
Some of my favorite authors are Chimdi Nwosu, Neil Richards, Ellen Blackburn, Daria Voronova, Adedamola Ladipo, Judit Bekker, Autumn Battani, Dzifa Amexo, Agata Ketterick, Priya Padham, Irene Diomo, Olushola Olojo, Ken Flerlage, Kevin Flerlage, and Wendy Shija.
We are celebrating 10 Years of Tableau Public. What is your favorite feature of Tableau Public?
There are many cool things about Tableau Public but the ability to make a copy of other people’s viz and explore it is my favourite feature by far!
If members of the #DataFam visit Lagos, Nigeria what do you recommend they do?
They should check out Nike Art gallery which has over 8,000 diverse artworks from various Nigerian artists. Of course, I have to recommend a food place and one of my personal favorites is Ilé Eros that serves fine Nigeria cuisine.

Zainab in London being a happy foodie.
Historias relacionadas

Tableau's Iron Viz Winners

Explore the 2026 Iron Viz Entries
 15 Diciembre, 2025
Iron Viz 2025: Where Data Took Flight
 6 Mayo, 2025