4 Mayo, 2021
Your Favorite Vizzes - A Look Back at April 2021


Have you ever wondered what are the most popular vizzes in a particular month? We’re excited to launch a new monthly blog series, Favorite Vizzes - A Look Back, to feature visualizations that were most popular across the #DataFam and their incredible work. Take a look at April’s most popular and most often favorited vizzes across the Tableau community.
Top 3 most-often favorited Viz of the Day (#VOTD) featured on Tableau Public:
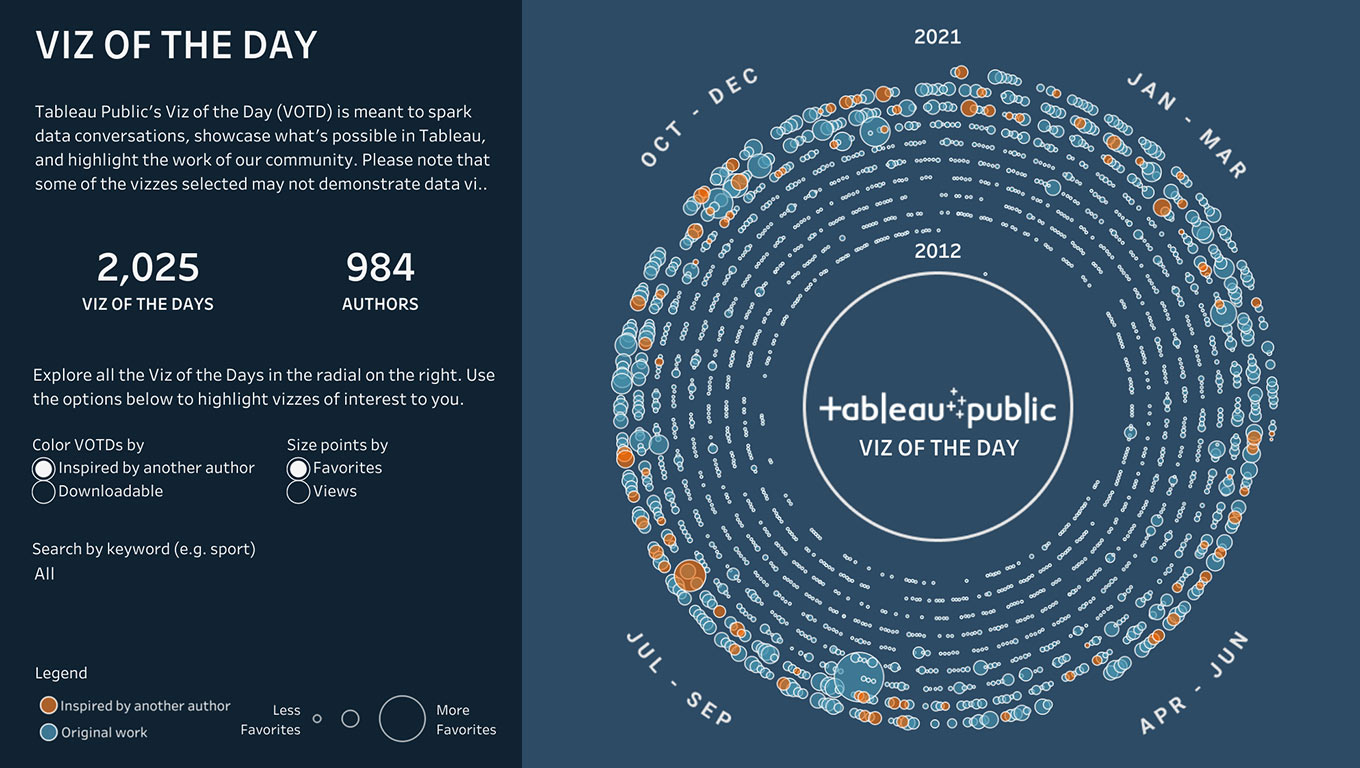
A Viz of the Day About #VOTD by Will Sutton A Viz of the Day (VOTD) about #VOTD? Yes! Check out this visualization by Will Sutton—based in London, England in the UK— to see the 2,024 visualizations that have been featured throughout the years. Make sure to "star" your favorite vizzes and help contribute to a future iteration of this data. Favorite this viz
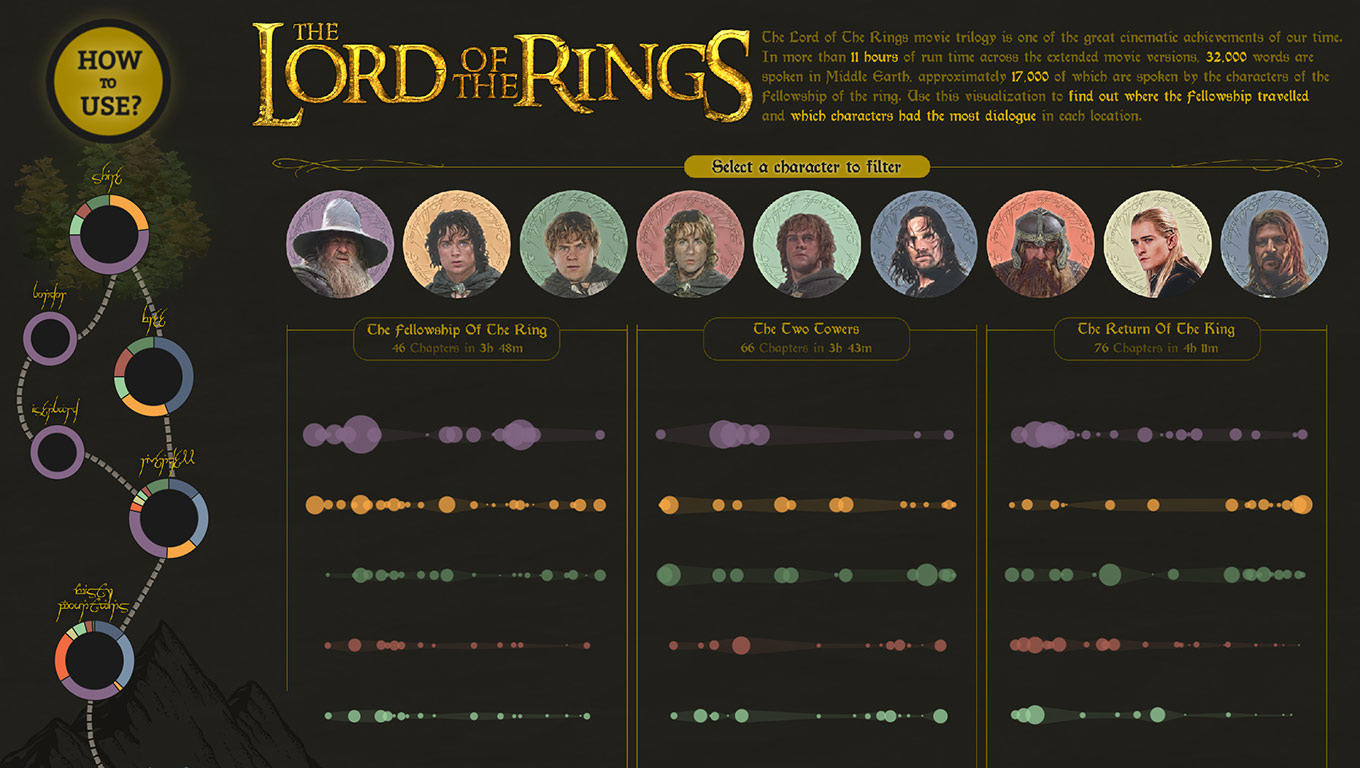
The Lord of the Rings by George Koursaros The Lord of the Rings movie trilogy is considered one of the greatest cinematic achievements of our time. In this visualization, George Koursaros— based in Nicosia, Cyprus—showcases the Fellowship's journey and how much dialogue the characters had in each location. Favorite this viz
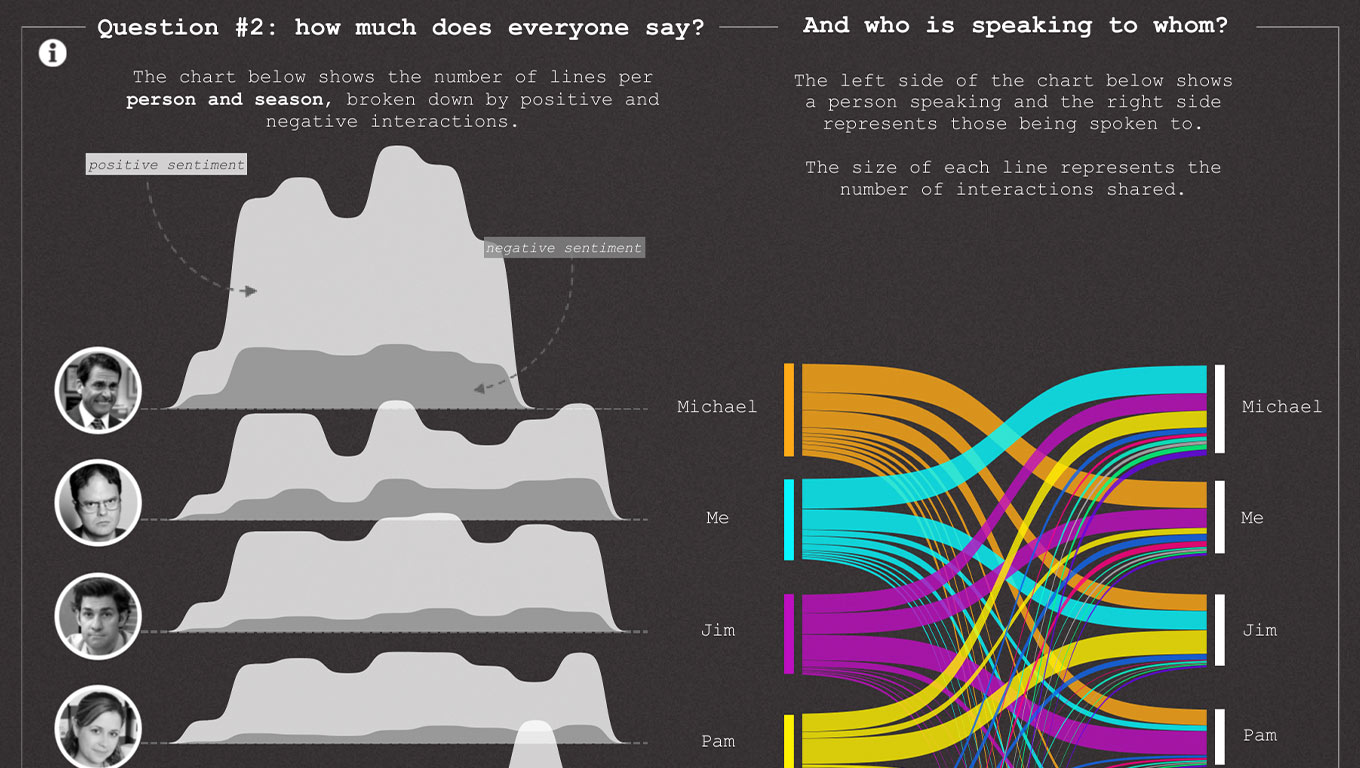
Dwight Schrute's Surveillance System by Kasia Gasiewska-Holc How many times have you watched The Office? Check out this visualization by Kasia Gasiewska-Holc—based in Gdynia, Poland—to see the most popular employees of Dunder Mifflin Paper Company, Inc., the interaction between the characters and their most unique words. P.S. Dwight Schrute's surveillance system videos are out! Favorite this viz
Top 3 most-favorited non-VOTD on Tableau Public:
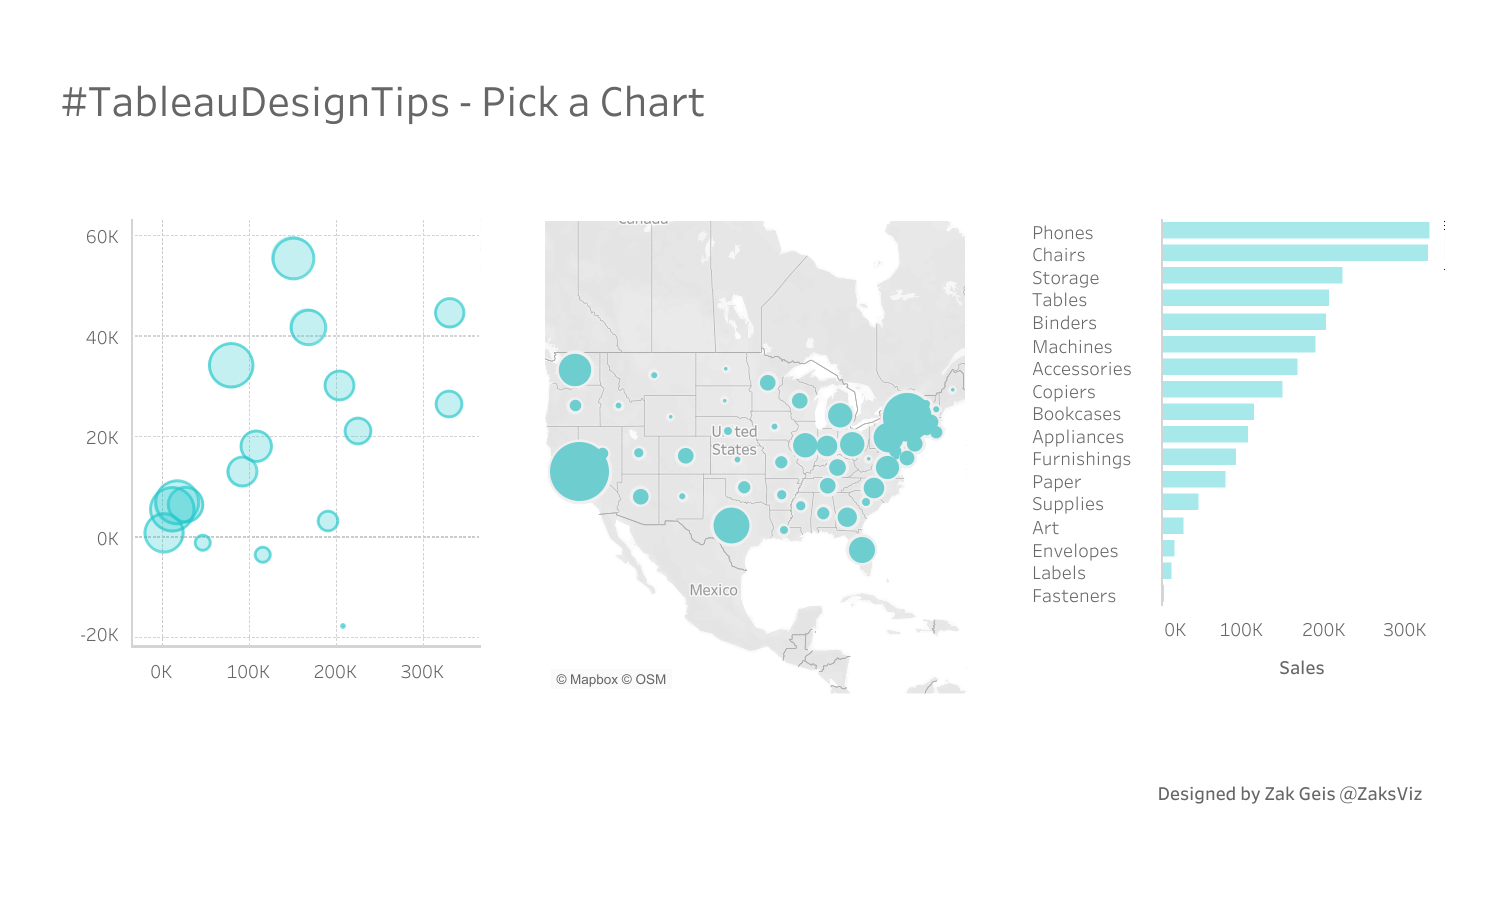
Pick a Chart - Design Tip by Zak Geis In this visualization, Zak Geis—based in Columbus, Ohio, United States— gives users a custom experience with chart selection in Tableau Favorite this viz
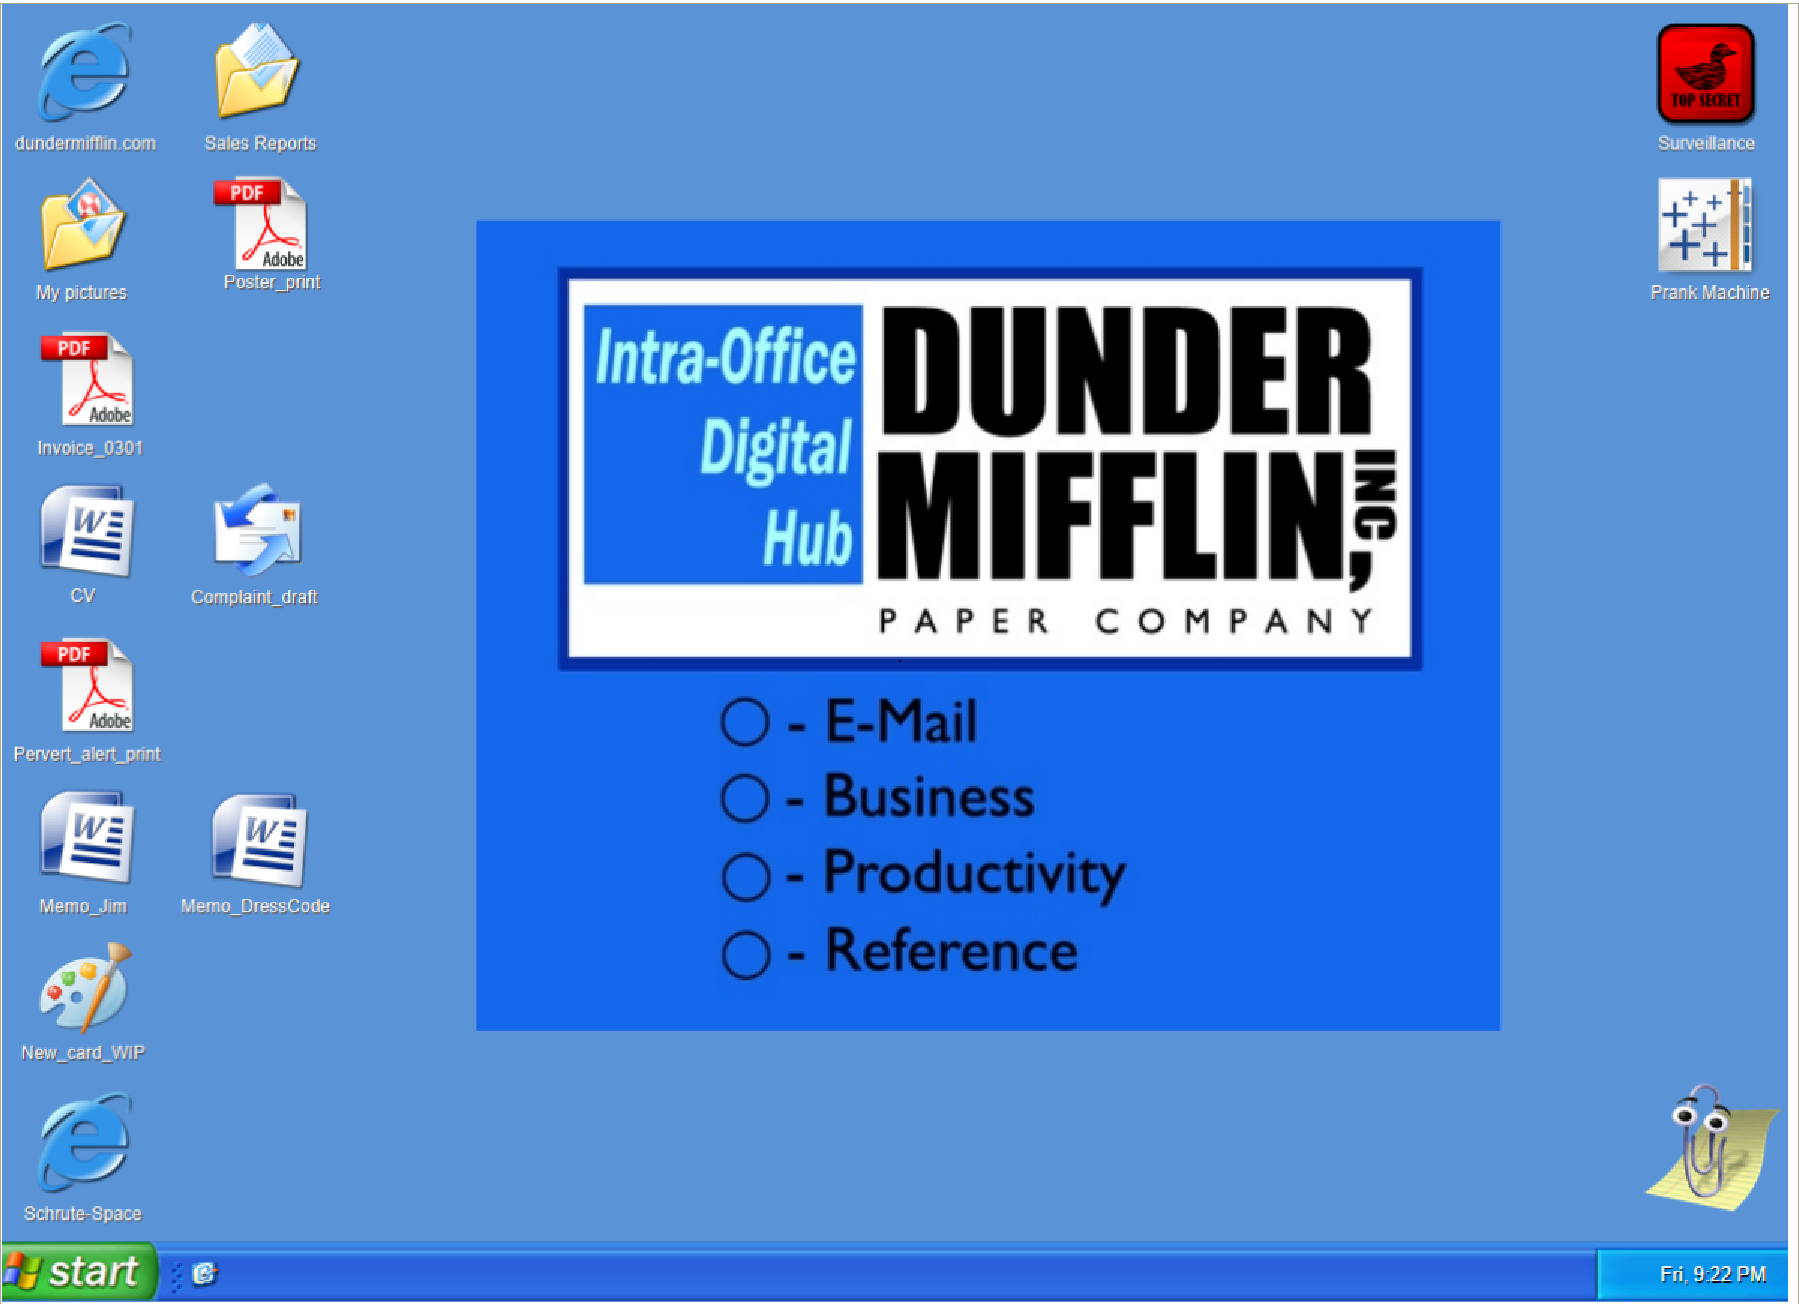
Dwight Schrute's Computer by Kasia Gasiewska-Holc Dwight Schrute's Windows account has finally been hacked! Check out this visualization by Kasia Gasiewska-Holc—based in Gdynia, Poland—to see some of Dwight's secrets. Favorite this viz
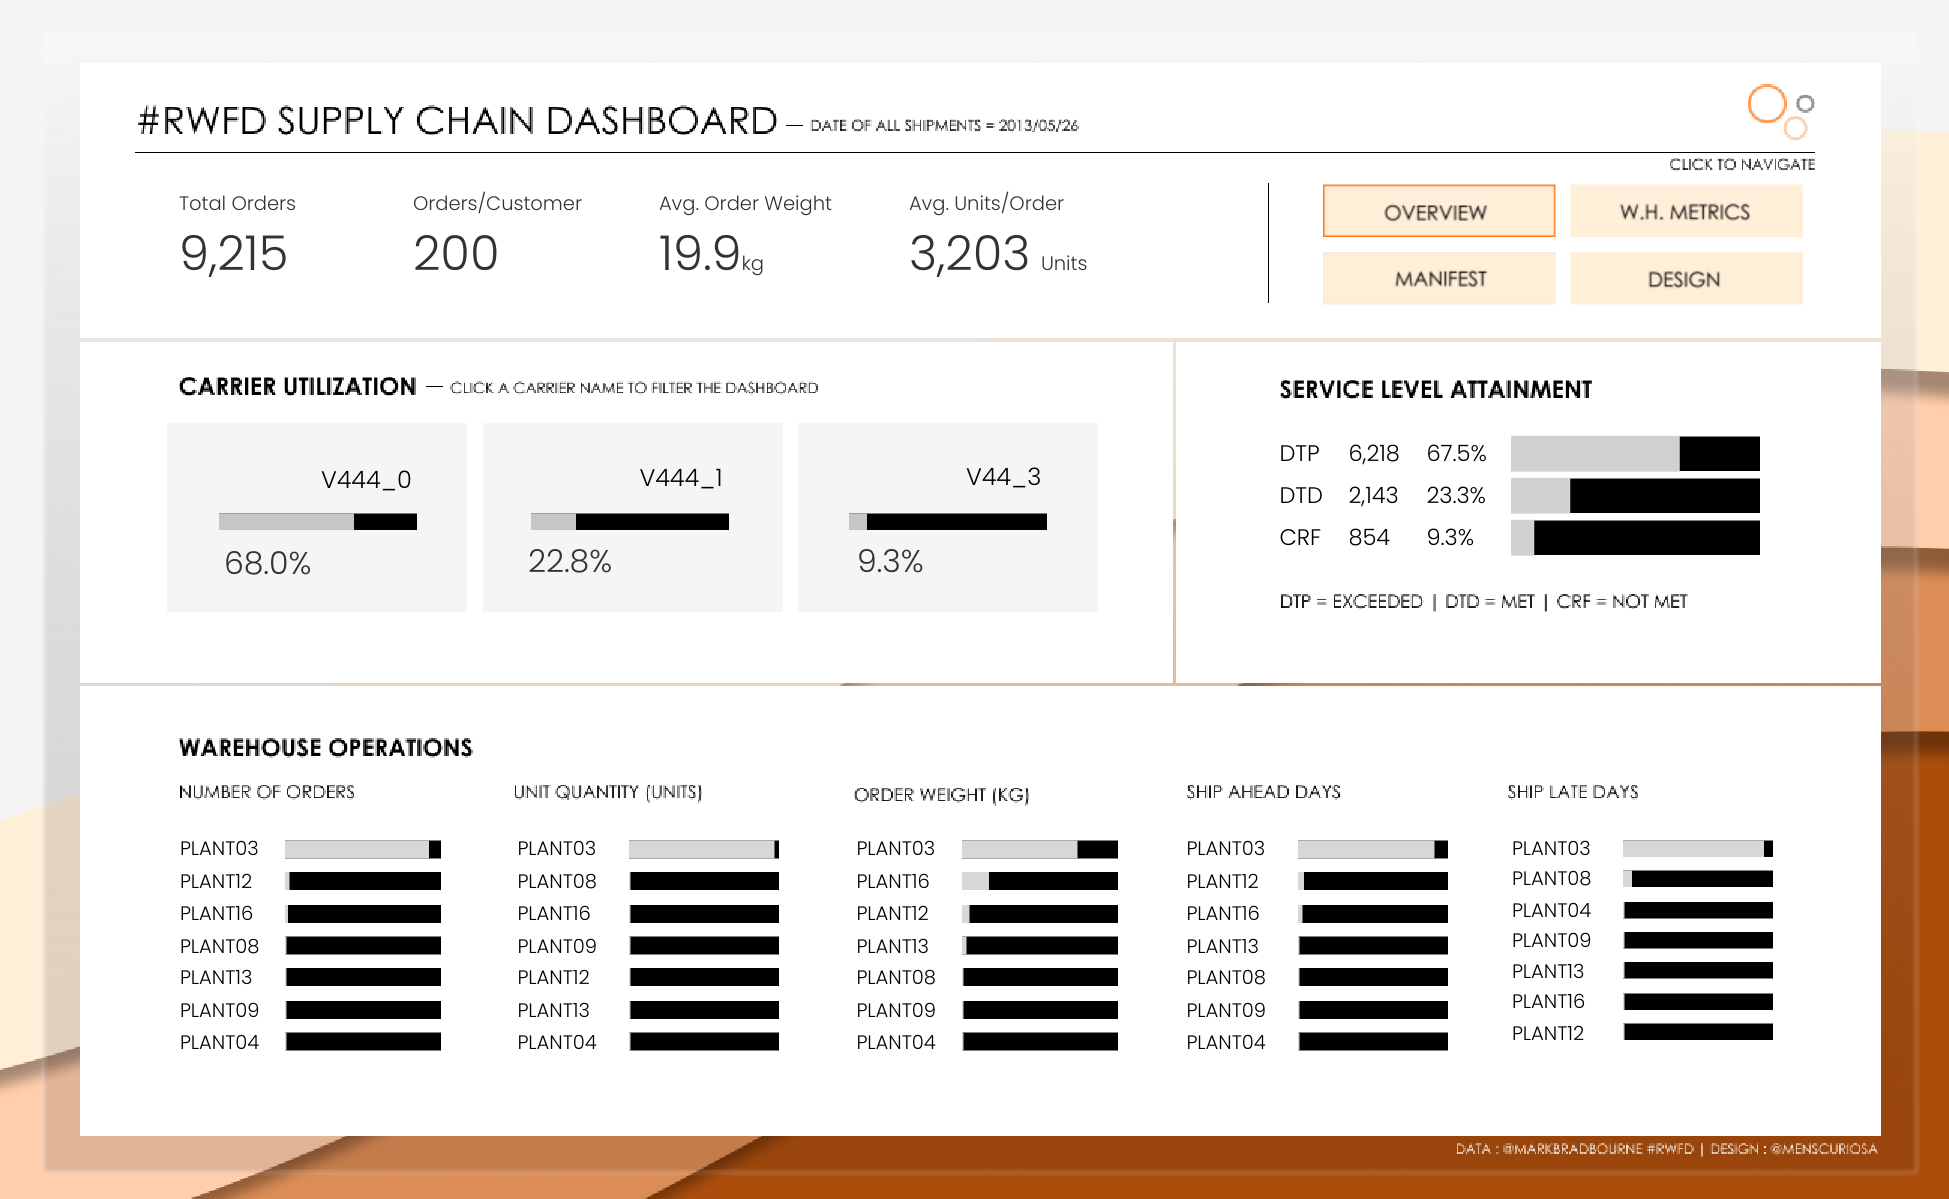
#RWFD Supply Chain Dashboard by Chimdi Nwosu Explore Chimdi Nwosu's—based in British Columbia, Canada—visualization, part of the #RWFD challenge which consists in creating insightful and engaging dashboards that provide relevant data insights to the business industry Favorite this viz
Most popular VOTD on Twitter and Facebook:
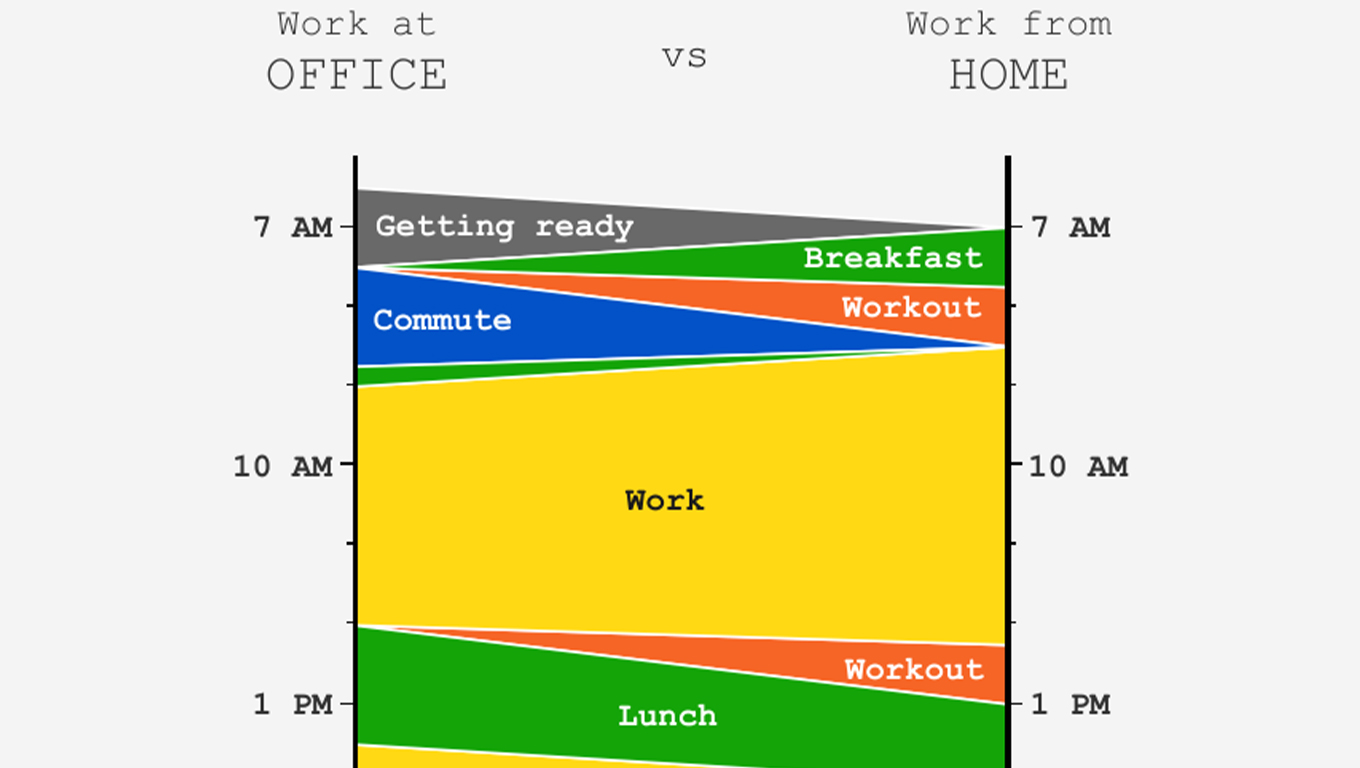
My Typical Days by Wendy Shijia How has your routine changed since working from home? Explore this #VOTD by Wendy Shijia—based in Shanghai, China—to see a comparison between her daily routines at the office versus at home. Favorite this viz
Historias relacionadas

Iron Viz
Iron Viz 2026: Read Between the Data
 28 Mayo, 2026
The 2026 Iron Viz stage was set, the finalists showcased their data visualization and storytelling skills, and a champion was crowned at Tableau Conference. Catch all the highlights, big reveal, and relive the magic of the 16th edition of this competition.

Iron Viz
Tableau's Iron Viz Winners
A collection of the winners' visualizations of Tableau's Iron Viz Championship.

Iron Viz
Explore the 2026 Iron Viz Entries
 15 Diciembre, 2025
Explore the 122 visualizations submitted during the 2026 Iron Viz global qualifier contest. The 2026 theme was food and drink.