What is the Veterans Advocacy Tableau User Group?


The Veterans Advocacy Tableau User Group is a community-led initiative for prior and current military service members, family, and advocates to share their stories, support veteran causes, and learn Tableau.
How did the Veterans Advocacy TUG get started?
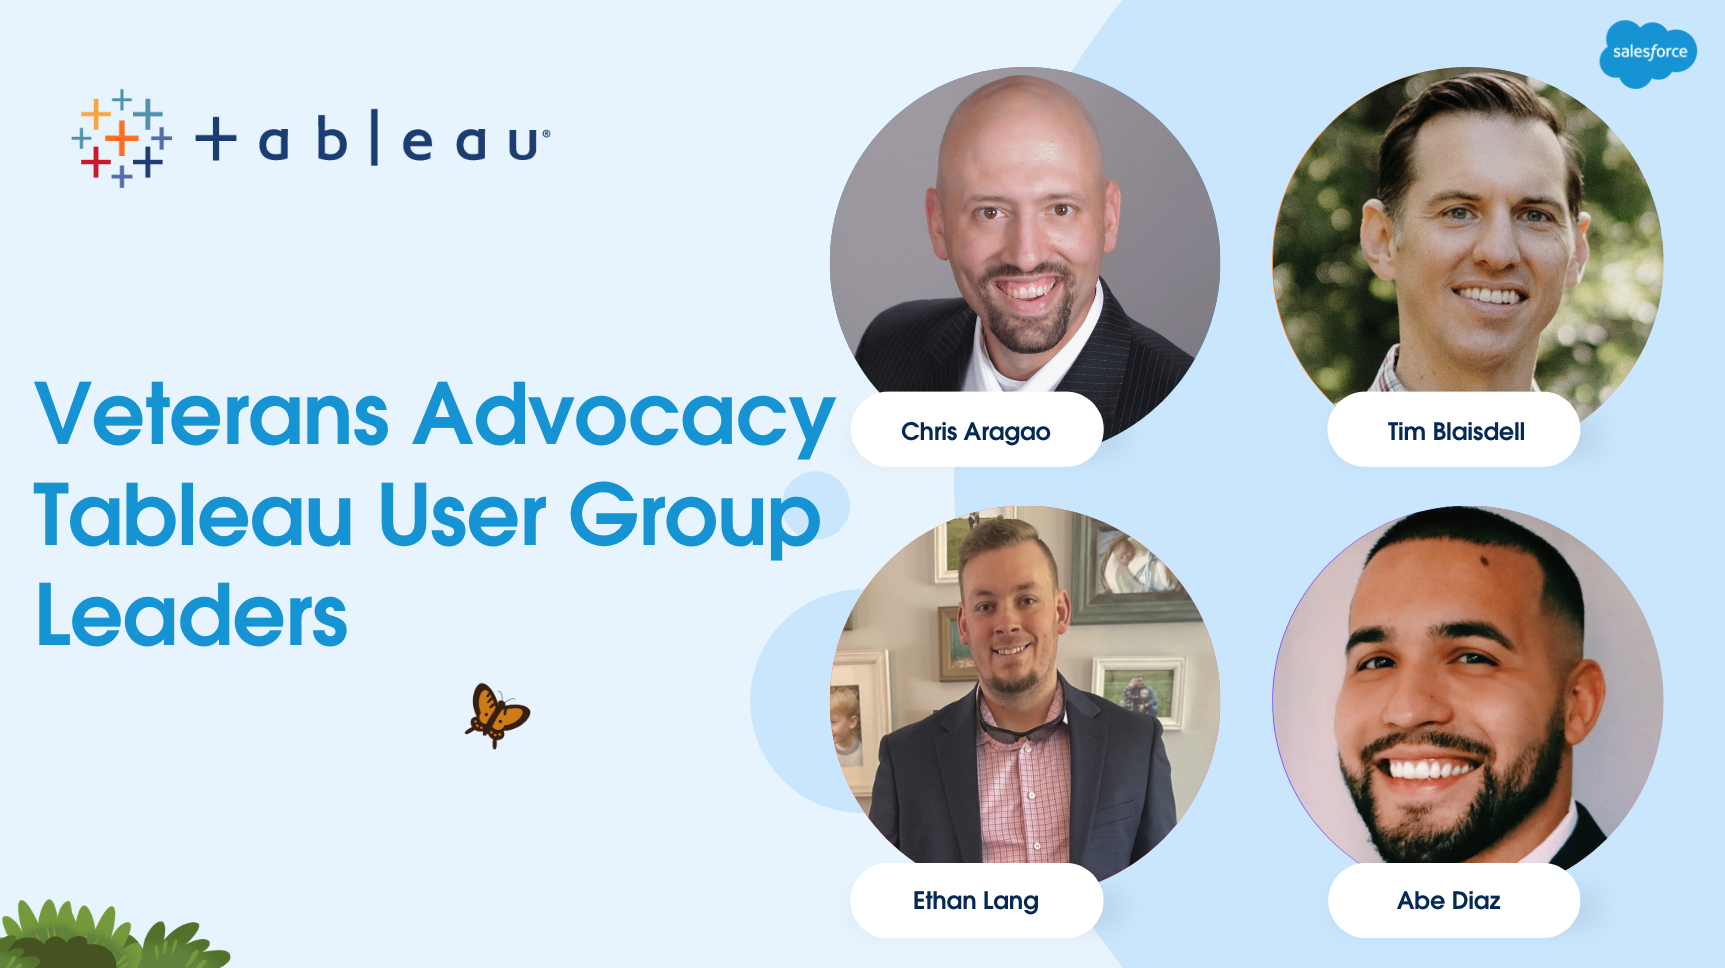
The TUG was started in early 2019 when founders Chris Aragao and Tim Blaisdell recognized an opportunity to support veterans learning Tableau. Since its founding, the group has grown its leadership team with the addition of Ethan Lang and Abe Diaz, launched a Viz-For-Vets Data Initiative with more than 5 projects, and meets regularly virtually. You can join the user group chapter here.
What is the group’s mission?
This group serves veterans, service members, and advocates by providing networking and focusing on projects that benefit the veteran community. The Viz or Vets Data Initiative, which the group manages, engages the community in telling these stories through data projects. “We hope that through our Tableau User Group, veterans gain the skills to compete in a growing field and to feel an enduring sense of comradery in a safe space where all are welcome, says Chris Aragao.
What are some examples of the group’s advocacy?
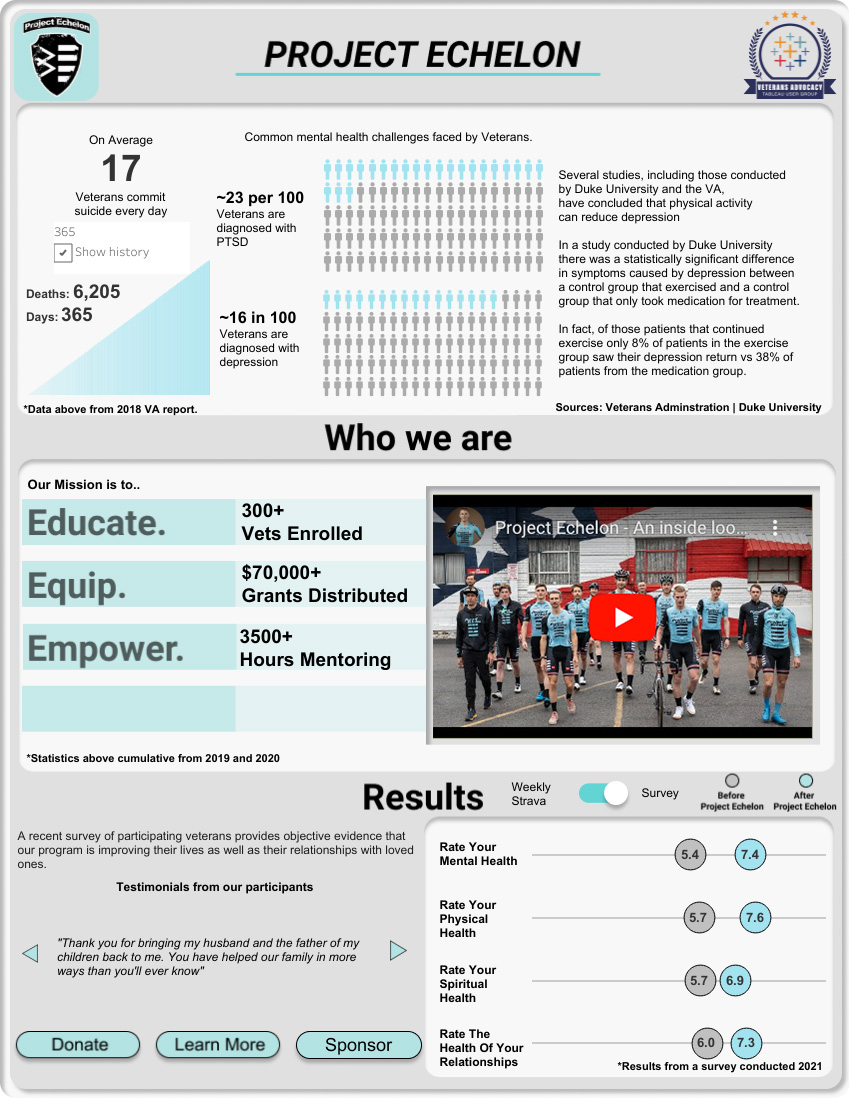
This Tableau Public dashboard created by Tableau Ambassador Ethan Lang appears on Project Echelon’s mission website. It shares about veteran mental health challenges, what Project Echelon is, and the impact the non-profit is having on veteran lives.
One group the Veterans Advocacy TUG supported was Project Echelon. The non-profit helps veterans find community and healing through exercise and competition, enrolling more than 300 vets and supporting them with more than $70,000 in grants and 3,500 hours of mentoring. The Viz for Vets Data Initiative created a challenge to show the non-profit’s impact through data.
Now the Viz for Vets Data Initiative’s dashboard, created by Ethan Lang, is featured on Project Echelon’s website–it quantifies the impact of the programs on the health and lives of the veterans involved. The dashboard shows that veteran Project Echeclon participants experienced improvements in the quality of their mental health, physical health, spirituality, and quality of their relationships.
Other projects the TUG has worked on have supported the veteran healthcare research non-profit HunterSeven Foundation by shedding light on the number of homeless veterans across the U.S., and have showcased the service of Tuskegee Airmen of WWII.
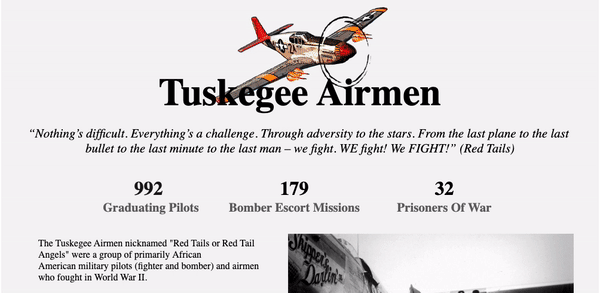
This Tableau Public dashboard by Aaron Vitiello shows data from the 2022 Tuskegee Airmen Challenge–a collaboration between The Viz for Vets Data Initiative and Tableau’s Data + Diversity team.
What should people joining the user group expect?
The Veterans Advocacy Tableau User Group creates a welcoming and informal environment. They focus on sharing their stories and networking with each other–discussing what got them active in data and what they’re excited about, while also bringing in Tableau Community members and experts to speak at meetings. Recent presenters have included Visionary Tim Ngwena, AT&T's Matthew Bovetz, and Altyerx's Albert Bellamy.
.
I received this metal today from speaking at a TUG session for the Veterans Advocacy Group. Thank you! This is cool!!! #tableau pic.twitter.com/QataXBSOBg
— Dawn Harrington (@techtipsgirl) May 12, 2022
A unique part of the Veterans Advocacy User Group is their signature challenge coin. A challenge coin is a small coin or medallion bearing an organization's insignia or emblem that is carried by the organization's members. Traditionally, they might be given to prove membership when asked and to enhance morale. All guest speakers receive one and many have posted theirs on social media with encouragement to others to pay it forward.
“Don't be intimidated, you have proven that you are more resilient than most. Dig in, do a little training each day, and you can do this.
Where should veterans and their advocates get started?
For Veterans Day 2022, the Viz For Vets Data Initiative posted a challenge to visualize data from VetPop, a population projection for vets. The challenge is to tell the veteran story by using demographic data projections for a variety of characteristics such as age, gender, period of service, and race/ethnicity. Then post the visualization using the hashtag #VizForVets on Tableau Public and learn from others.
#VIZFORVET CHALLENGE ALERT! The VetPop is an population projection for vets. It provides demographic data projections such as age, gender, period of service, and race/ethnicity. Check it out at https://t.co/KWLX1JYNjd or on our NEW WEBSITE! https://t.co/HYL82q2S4p
— Veterans Advocacy TUG (@VetsAdvTUG) October 22, 2022
Whether you're a seasoned data professional with years under your belt or a DataFam newbie, the Veterans Advocacy TUG is ready to add you to their ranks! Stay up to date with this group here.
Historias relacionadas

DataFam Roundup June 2026

DataFam Roundup May 2026

Iron Viz 2026: Read Between the Data
 28 Mayo, 2026