Get Interactive with Dynamic Spatial Parameters in Tableau


Our customers increasingly reach for geospatial analysis to better understand their customers and their business. As organizations leverage location-based data, we've seen a significant growth in the demand for more intuitive and dynamic ways to interact with maps in business intelligence platforms. In the Tableau 2025.2 release, we have introduced an exciting feature, Map Viewport Parameters also referred to as Dynamic Spatial Parameters, which lets you interact with maps more powerfully. With this feature, we enable the ability to filter data on a map as you zoom and pan. You also have the ability to filter data on multiple worksheets as well as zoom and pan several map views on a dashboard at the same time.
This feature enables you to create more interactive and responsive map visualizations. It enhances Tableau’s existing spatial parameters capabilities, bringing the complete Tableau analytical experience to geospatial data and providing customers with more control over map position and scale.
How Dynamic Spatial Parameters Work
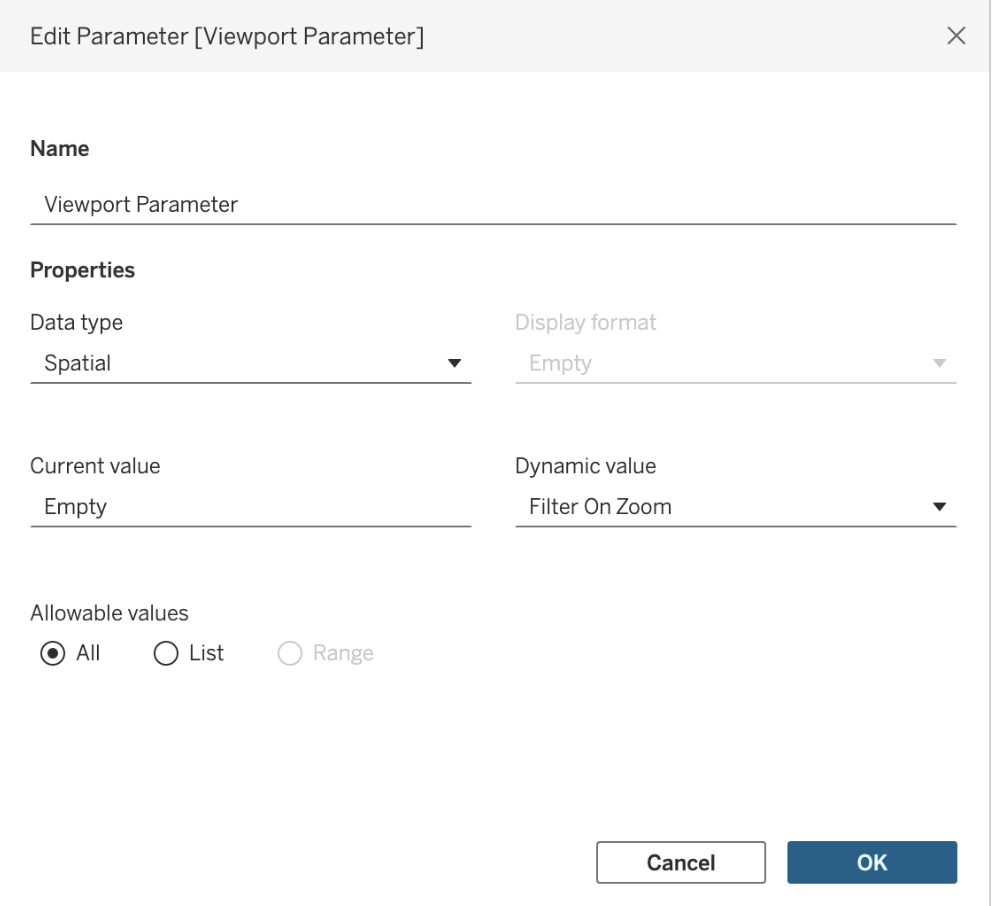
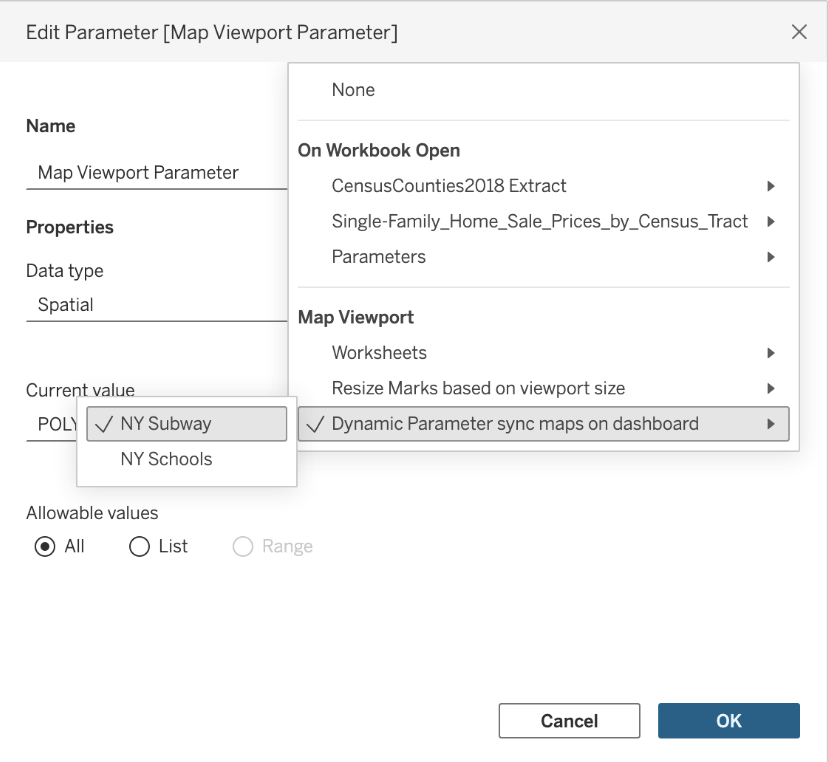
A map viewport in Tableau is the area of the map that is currently visible. A viewport can be thought of as a window that can vary in size and shape, allowing you to see different portions of the map. The viewport changes when you zoom in and out, pan, etc. Each instance of a map, whether on a worksheet or a dashboard, has its own viewport. With map viewport parameters, Tableau captures the viewport (as a rectangular polygon) int o a spatial parameter that you have created. You then set the “Dynamic” value of the spatial parameter to update based on either the sheet or the dashboard, as shown below.
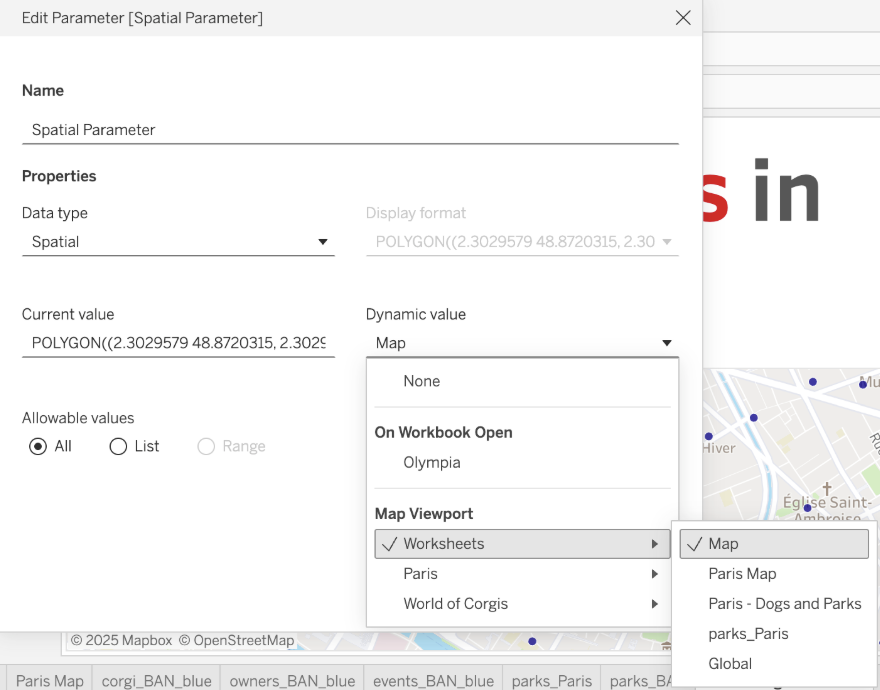 Once the map viewport parameter is active, it automatically updates as you zoom or pan. You can reference it in calculated fields to drive other map visuals. You can visualize the parameter by using it in a calculation to see the current viewport.
You may also use dynamic map viewport parameters with various spatial functions in Tableau for more interactive and synchronized map-based analysis across your Tableau dashboards. Some of these use-cases are highlighted in the following sections.
Filtering Based on your Map Viewport
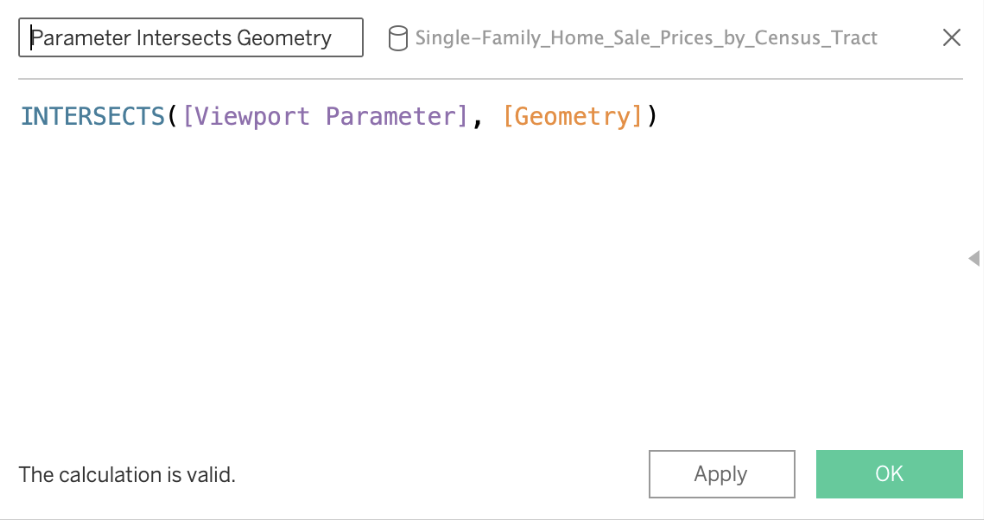
The power of dynamic spatial parameters truly shines when integrated with Tableau's spatial functions. If you have spatial data in your visualization, you might use the Intersects function to filter points that intersect with the current map viewport.
-
Create your map viewport parameter and set the viewport to your target sheet or sheet in the dashboard.
-
Create a calculation with the formula: Intersects([Viewport Parameter], [Geometry])
-
Drag that calculation onto the filter shelf and select True and OK from the filter dialog.
Now whenever your map viewport changes, your filter also changes.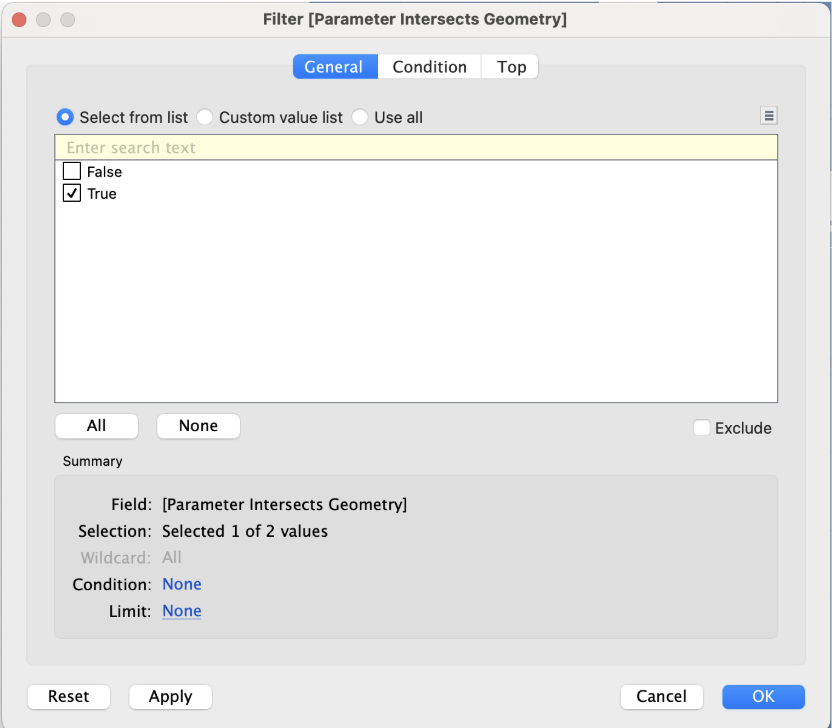
Syncing Two Maps in a Dashboard
With map viewport parameters, use one map’s viewport to drive another map viewport in a dashboard. As you change locations in your target map, the map consuming that parameter will update.
1. Create a parameter that targets a map sheet located in the dashboard.
2. Consume that parameter in a second sheet. Some ways to do that are by visualizing the parameter in a calculation or using the intersects filter on the sheet. Drag that second sheet on to the dashboard.
Integrating with Spatial Calculations
Because the map viewport parameter is a spatial data type, you can use it for a spatial column in any of the calculations that allow them. Some possibilities are:
- Area - Use Area to change the size of marks based on viewport size or filter out all spatial values larger or smaller than the area. Changing mark size based on zoom level is particularly useful for hexbins.
- Intersection - Visualize the intersection of your geographic area and the map viewport.
- Use spatial operators to compare different map polygons, generating new polygons based on the current viewport.
Map viewpoint parameters empower you to create highly responsive map experiences that seamlessly adapt to your exploration, making geospatial analysis more intuitive and powerful than ever before.
This feature is currently available in Tableau Cloud web authoring and in the Tableau Desktop application. Learn more about Map Viewport Parameters, and if you’d like to connect with the product managers behind Tableau’s innovations, register for Tableau’s DataFam Discovery Inside Track events to get exclusive insights.
Historias relacionadas
Monitor Tableau Cloud Deployments of Any Size with the Platform Data API
 2 Enero, 2026
Tableau New Features Released in 2025 from Community Ideas
 30 Diciembre, 2025
Keep Payment and Cardholder Data Secure with PCI-DSS Compliance for Tableau Cloud
 10 Julio, 2025