Iron Viz 2019 Agriculture Results


The results are in for the first Iron Viz global qualifier! We received 75 impressive entries— but there can only be one winner. Read on to find out who will be advancing to the live Iron Viz Championship at the 2019 Tableau Conference in Las Vegas.
For this qualifier, we tried something a little different and required the use of a single data set: the United States Department of Agriculture’s (USDA) 2012 Census of Agriculture. The data set was challenging, but we were pleased to see not just a 25% increase in participation compared to last year’s first qualifier, but 60% new entrants.
The USDA was wowed by all entries!
Embracing the OPEN Data movement, the National Agricultural Statistics Service (NASS) has worked to make their data complete and accessible. Thanks to their efforts, the general public can explore (and create Iron Viz entries with!) data from the USDA.
We shared the 75 entries with the NASS and the USDA to get their reaction. NASS Administrator Hubert Hamer commented, “We were pleased that people found so many different opportunities to present the data with dynamic, innovative visualizations. These visual insights help us inform policy, research, education, advocacy, business, and many other purposes.”
“The breadth and depth of the entries was staggering,” added USDA Chief Data Officer Ted Kaouk. “It was fun to see how people took our data and reused it to create new solutions and do unexpected things— everything ranging from demographic analyses to farm profitability, from where crops are being grown to the difference between pasture and cropland.”
Data competitions connect the USDA to people just like you: passionate, data-savvy individuals who can transform their data into compelling insights. And according to Kaouk, “seeing the ways people use our data also helps us better understand how we can drive public sector innovation, and how we might be able to make our data even more consumable for the general public.”
Keep exploring with the USDA’s new 2017 data!
Looking to find out what has changed in U.S. agriculture since 2012? You’re in luck because the NASS just released the 2017 USDA Census of Agriculture! A few spoilers: farm income is declining, input costs for things like seeds and labor are rising, and there are more women in agriculture than ever before. Get inspired by one of the entries, compare insights from 2012 with those from 2017, and share your viz on Tableau Public!
Judging the entries
Iron Viz judging has been a hotly-debated topic in the community. In an effort to be as transparent as possible, we’ve summarized how the process works.
First-round judges from the community scored each viz, narrowing the list to a Top 10
We asked Tableau Ambassadors, Zen Masters, past Iron Viz finalists, and others active in the community to help us narrow down the submissions. A huge THANK YOU to our first-round judges, who volunteered their time and expertise—David Pires, Ivett Kovacs, John Mathis, Joshua Milligan, Pablo Gomez, Ravi Mistry and Timothy Vermeiren.
We had multiple judges score each visualization to ensure fairness and minimize bias. Submissions were scored on Analysis, Design, and Storytelling, and the scores were averaged to calculate the Top 10. Some of the reactions from our judges:
"The vizzes that were on the top of my list had a balance of great design, playful interaction, and the right chart-types," explained John Mathis.
"It was amazing to dive into the complex analysis, detailed designs, and compelling stories – and all of it unique even though the data set was the same," commented Joshua Milligan.
"I was honored to be an Iron Viz judge...I remember tweeting three years ago about how difficult it would be for the judges… and it was!" added Ravi Mistry.
Final-round guest judges scored the Top 10 vizzes and selected a winner
Next, our final-round guest judges independently reviewed the Top 10 vizzes and scored each based on the same criteria as the first-round judges. THANK YOU to guest judges Amy Cesal, Elijah Meeks, and Jason Forrest!
And the winner is…
Pasture and Crop: The Ways We Farm Our Land by Joshua Smith
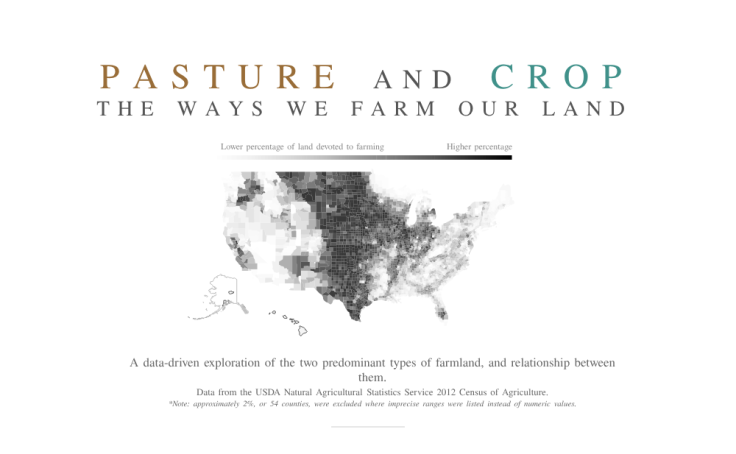
“I really appreciate the granularity and rigor that went into this project. Each aspect seems to be carefully considered and designed.”- Guest Judge Jason Forrest
Help us congratulate Joshua Smith— follow his Tableau Public profile!
The Top 10 entries
This year, 34% of our 75 entrants were women and 60% were first-time participants. And the newcomer with the highest score was also our winner, Joshua Smith. Check out the Top 10 entries below:

Iron Viz is more than just a data competition, it's a chance to challenge yourself and improve your skills. Congratulations to everyone that participated!
A quick note on feedback
Please note that first-round judges determined that all submission feedback would be provided in the format of numerical scores only, and not written comments. If you are one of the 75 entrants, you should be receiving your numerical score shortly!
Historias relacionadas

Iron Viz 2026: Read Between the Data
 28 Mayo, 2026

Tableau's Iron Viz Winners

Explore the 2026 Iron Viz Entries
 15 Diciembre, 2025