First-time Iron Viz participants share their experience


No matter what stage you're in on your data journey, there's always something new to learn, and the Iron Viz qualifier competitions offer the perfect opportunity. Maybe you want to try a different design style or chart type, experiment with storytelling approaches or try out a new Tableau feature. Whatever the reason, you are guaranteed to gain new skills and inspiration throughout the process. But it can be scary to take the leap.
Among this year's top ten qualifier finalists were several first-time Iron Viz qualifier entrants. We reached out to CJ Mayes, Ryan Soares, and Anne-Sophie Pereira to find out more about their Tableau journey and what inspired them to take the Iron Viz challenge.


England, United Kingdom
What is your Tableau story, and what made you decide to enter Iron Viz this year?
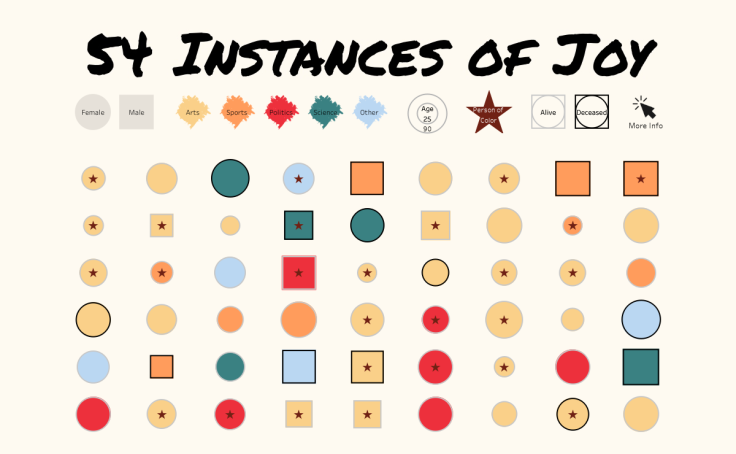
CJ Mayes: I joined Tableau Public roughly 18 months ago now. Like many, my Tableau journey is fueled by the desire to learn. By trade, I'm meant to be a data engineer—but it's important to take a holistic view of data, which involves building out a technical skill set in all different areas. Little did I know then how much I would fall in love with creating visualizations. I always say I owe credit to Amar Singh while I was at Lloyds for being so supportive and encouraging me to make the leap to having a public profile. Entering Iron Viz just felt right. I thought the topic of joy was spot on, given the last year or so. I hadn't spent a huge chunk of time on a visualization, having steered more towards blogging the past year, so I wanted to create something that paid homage to my journey so far.
Ryan Soares: I've been using Tableau for four years. I was introduced to it on an internship during university, which sparked my interest in data visualization. I participated in community-led initiatives like Makeover Monday and Sports Viz Sunday to develop my viz skills and eventually started working on my own passion projects. Currently, I'm working as a data visualization consultant, so I often use Tableau for professional and personal projects.
I had wanted to participate in Iron Viz for the last couple of years, but I couldn't find the right dataset or topic to motivate me. For this year's competition, a colleague of mine had a shared goal to submit a viz, so we held each other accountable. The theme was also open-ended, so I could find a dataset and topic I was passionate about.
Anne-Sophie Pereira: I've been learning and using Tableau for 2.5 years and shared my first Makeover Monday on Tableau Public 2 years ago. Although I cringe looking back at it, I keep it available publicly so that anyone can see how much progress one can make in two years. I decided to enter Iron Viz with an absolute ignorance of how much time I would have to dedicate to this project, ha ha! Seriously, the sub headline of the competition, 'Win or learn—you can't lose', neatly summarizes why you should enter. Besides, the topic was fun and an opportunity to share a passion.
This year, we challenged you to visualize data on a topic you love, and it was fantastic to see the diverse range of passions on display throughout the entries. Can you share a little more about your visualization and why you chose this subject?
CJ Mayes: The longer story is that I do goal setting every year and, as part of that, pick a person who portrays values that resonate with me. This year was text
Roger Federer. Yes, I love sessions on goals and values— call it cliché—I don't mind. The short story is sports are great.
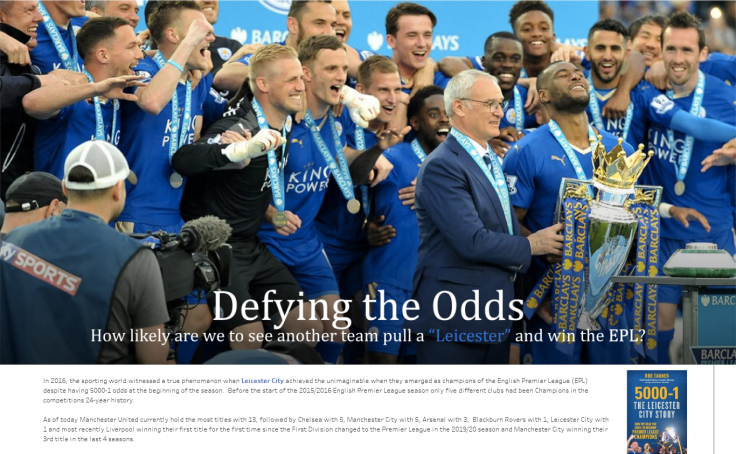
Ryan Soares: My viz—Ten Seconds of Glory—was an overview of the men's 100 meters competition and its athletes. All my ideas were sports-related, but I settled on the 100 meters since the excitement of the event is universal. You don't have to be an avid sports fan to be interested in the race and understand what's happening. Also, with the Olympics approaching, I felt it was a fitting topic.
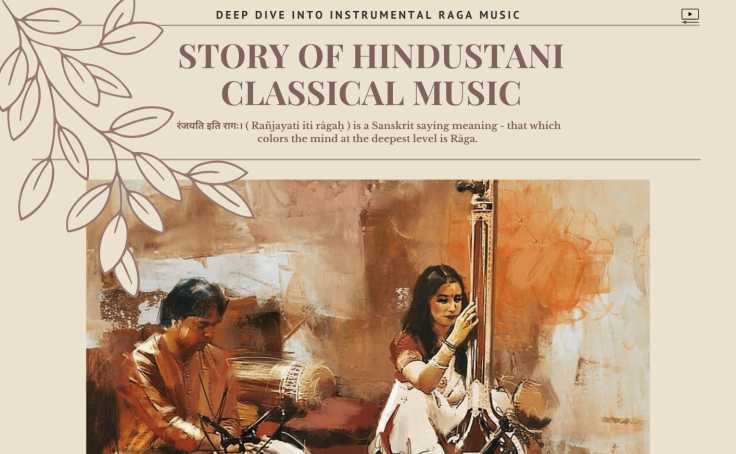
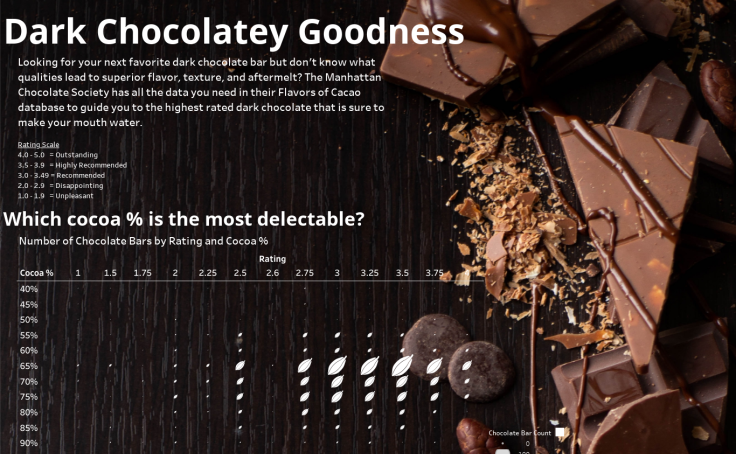
Anne-Sophie Pereira: I created a viz around 6 reasons to (re)watch Buffy the Vampire Slayer because I truly think you should (re)consider watching this TV show despite prejudices that content labeled 'Young Adult' commonly face. I used a wide variety of data points to highlight the quality of the screenplay, such as episode ratings, dialogue time broken down by gender, pop culture references inside the show, and paybacks and foreshadows between episodes.
What surprised you about the Iron Viz qualifier contest?
CJ Mayes: The sheer quality and breadth of the visualizations. I loved seeing all the different subjects that bring people joy. I feel like I learned a little about the person behind the viz, which is always great. The most fun part for me was experimenting technically with layering but using it in different ways.
Ryan Soares: How fast the time goes definitely surprised me. I played around with different datasets for the two weeks and only settled on my topic with a week and a half left. I would have liked to spend more time building the viz and iterating. The most fun part was building the viz since I was experimenting with stories using dashboard buttons.
Anne-Sophie Pereira: The quality of the entries gets better and better each year—and I feel very privileged to have been selected in the Top qualifiers.
What's your advice to those who haven't participated in Iron Viz but are considering it for next year?
CJ Mayes: Find your 'why.' It really isn't (all) about winning. Neither is it about comparing your viz to others. Build something for you because you love the topic, want to test your abilities, and want to try something new. There are a million reasons to get involved, and remember, you have the wholehearted backing of the community. You won't regret entering!
Ryan Soares: Don't feel that you have to create a masterpiece visualization to participate in Iron Viz. This is something that stopped me from submitting in previous years as I felt my viz wouldn't be good enough to win. This year, my goal was to try a different design style, and I focused on telling a clear story with interesting analysis. My aim wasn't to win the competition; rather, I focused on creating the best viz I could with the time available and learning new techniques.
Anne-Sophie Pereira: Today is the perfect day to get started. There are tons of options to practice, such as Makeover Monday, Workout Wednesday, or the perfect exercise for Iron Viz: Iron Quest.
Design with your audience in mind, not for the competition. Yet, understand what the judges value, for instance, by reading this blog from Adam Mico. Seek feedback early, often, and from different kinds of people: from data viz professionals to people who know very well the topic you are focusing on and people who are not into your topic and data viz in general.
How has the Tableau Community helped your data journey? Was Community support a factor in your decision to enter the Iron Viz qualifier this year?
CJ Mayes: It would be wrong not to mention Autumn Battani, as she gave me the verbal boost I needed to start. It was lovely to see a lot of people create feedback sessions and offer words of encouragement publicly during the month. Sarah Bartlett particularly did a great job of this!
Technical build-wise, you may have seen vague links to styles, designs, and templates from Kevin Flerlage, Alex Jones, Mariona Banyeres, and Toan Hoang. I think you slowly accumulate your own style that is a blend of community members. That’s the beauty of the community.
Ryan Soares: The community has been instrumental in my data journey. I owe much of my development to initiatives like Makeover Monday and Sports Viz Sunday, which allowed me to practice data viz regularly and receive feedback. My decision to enter Iron Viz this year was influenced by a colleague, Jason Yang (@AnalyticsWhy). We had a shared goal to participate, and he kept me accountable so that I could complete my viz on time.
Get a front-row seat to the November finals
We appreciate these three first-timers sharing some of their experience and inspiration with us. They did a fantastic job, and we can't wait to see what they come up with next. If you're like us, you are counting the days to see who will reign supreme in the final showdown. Be sure to save the date and tune in to the Iron Viz Championship at Tableau Conference 2021.
See all the first-time entries for 2021


Historias relacionadas

Iron Viz 2026: Read Between the Data
 28 Mayo, 2026

Tableau's Iron Viz Winners

Explore the 2026 Iron Viz Entries
 15 Diciembre, 2025