DataFam Roundup: September 18–22, 2023


Welcome! Dig into this week's DataFam Roundup—a weekly blog that brings together community content all in one post. As always, we invite you to send us your content—and the DataFam content from your peers that have inspired you! Find the content submission form here.
Community Highlight
To recognize new and consistent Tableau contributors—we’re excited to have a section within the weekly DataFam Roundup called the Tableau Community Highlight. Find out how to get involved.

Fabio Fantoni, Head of Modern Business Intelligence at BitBang, Data Journalist at Il Sole 24 Ore
Bologna, Italy
Fabio Fantoni is the Head of Modern Business Intelligence at BitBang and a Data Journalist at Il Sole 24 Ore. As a Tableau user of over 8 years, Fabio has published over 600 vizzes on Tableau Public. He also co-leads the Bologna Tableau User Group.
After discovering Tableau through work, Fabio was amazed by the tool and began to explore it outside of work. A few months later, he created a Tableau Public profile and later attended Tableau conference as well. He describes his relationship with Tableau as “love at first sight.”
Overtime, Fabio has published hundreds of vizzes on Tableau Public. He has visualized many datasets relating to the NBA, combining two of his interests: data and basketball. Fabio enjoys leading the Bologna Tableau User Group because it encompasses what the Tableau Community is all about to him: sharing knowledge, connecting with others, and listening to different perspectives.
Connect with Fabio on Linkedin, X, and Tableau Public.
DataFam content
Dive into content created by the Tableau Community:
-
Venkatesh lyer, phData:
-
Klaus Schulte, co-data.de: 14 Tips to Let Your Tableau Income Statement Shine - VIZJOCKEY.com
-
Adam Green, #Coffeetableviz: A pinch of design | in pursuit of elegance
-
Alex Barakov, Anastasiya Kuznetsova: #InformationDesign Songbook. Episode 2
-
Louis Yu: GNV Live Builds | Look Ma, Gaming could be a career...
-
Funke Bishi, The Data Leadership Collaborative: 6 Strategies to Assess and Advance Data Governance Maturity
-
Marc Reid: Dynamically Change Axis Start and End Values
-
Andy Kriebel: Mastering 4-Level Map Drill Downs in Tableau
-
Sekou Tyler: Episode 30 of #TenMinuteTuesday with TableauTim
-
PolicyViz: Episode #244: Maureen Stone
-
Dawn Harrington, Tech Tips Girl: Take Bar and Line Charts from Boring to Exciting!
-
Sam Epley: Color Contrast & Accessibility Tester
-
Victor Muñoz: Diary of One Visualization for Social Good
-
Deepak Holla: What are Data Connections, Data Sources and Data Models in Tableau?
-
Darragh Murray: Tableau Tip: A Method to Remove Flashing Border around Text Marks
-
hidethetable: How to Create an Organisation Chart on Tableau - My Way
Team Tableau
Upcoming events and community participation
-
Chart Chat Live--Round 44: September 21 - Watch as Jeffrey Shaffer, Steve Wexler, Andy Cotgreave, and Amanda Makulec debate the good, bad, and "scaredy-cats" of data visualization.
-
Demystifying the way to learn Data Visualization! Are you looking for a way to learn Data Visualization and feeling lost? We all have been there and I am going to help you understand the fundamentals and look for a way to learn data visualization.
-
Career Pathmakers: This is the launch event for the Career PathMakers user group. This group will be focused on helping its members navigate challenges in their careers, both with a mentorship program and a transition support program.
-
Viz Collab is back: Hello everyone! I’m excited to be opening #VizCollab back up for another round of matches! In the last year I matched around 40 people for some amazing vizzes, including Viz of the Days and a viz that was featured in a local publication. So if you want to find a collaboration partner sign up.
-
Local Community Conferences by the DataFam, for the DataFam.
Vizzes
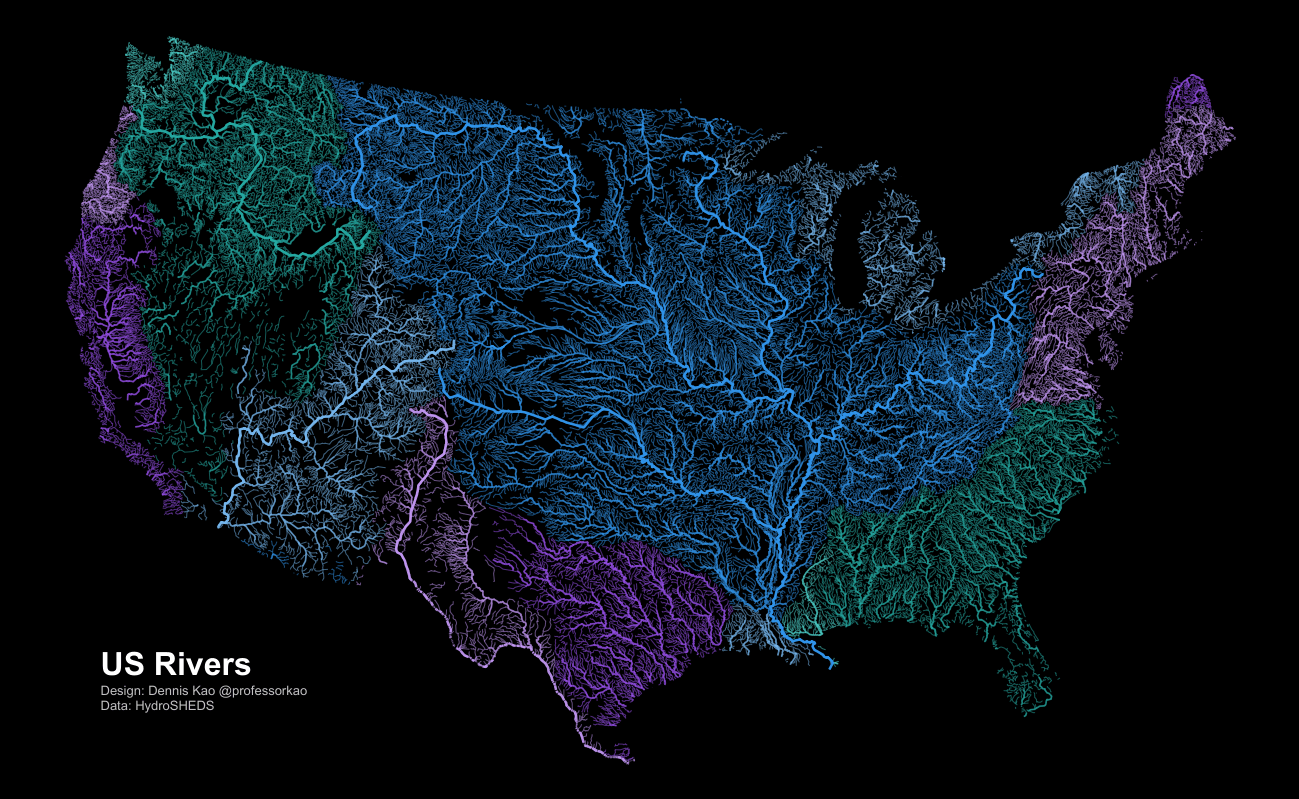
Dennis Kao: United States Rivers
See the latest Viz of the Day, trending vizzes, featured authors, and more on Tableau Public.
Check out some inspirational vizzes created by the community:
-
Dennis Kao: United States Rivers
-
Shazeera Ahmad Zawawi: The Wonderful World of Ghibli
-
Rob Taylor: Rugby World Cup 2023
Community Projects
Back 2 Viz Basics
A bi-weekly project helping those who are newer in the community and just starting out with Tableau. Not limited just to newbies!
Web: Back 2 Viz Basics
Twitter: #B2VB
Week 18: Build a Dot Plot
Workout Wednesday
Build your skills with a weekly challenge to re-create an interactive data visualization.
Web: Workout Wednesday
Twitter: #WOW2022
Week 38: Can you build a drunken tree chart?
Makeover Monday
A weekly social data project.
Web: Makeover Monday
Twitter: #MakeoverMonday
Week 38: America’s Eviction Crisis
Preppin' Data
A weekly challenge to help you learn to prepare data and use Tableau Prep.
Web: Preppin’ Data
Twitter: #PreppinData
Week 38: Sustainable Development Goals
DataFam Con
A monthly challenge covering pop culture and fandoms.
Web: DataFam Con
Twitter: #DataFamCon
September 2023: Barbie World!
EduVizzers
A monthly project connecting real education data with real people.
Web: Eduvizzers
September 2023: School Book Bans in the United States
Games Night Viz
A monthly project focusing on using data from your favorite games.
Web: Games Nights Viz
Twitter: #GamesNightViz
Season 2: Battle of the Strongest
Iron Quest
Practice data sourcing, preparation, and visualization skills in a themed monthly challenge.
Web: Iron Quest
Twitter: #IronQuest
White Space
Storytelling with Data
Practice data visualization and storytelling skills by participating in monthly challenges and exercises.
Web: Storytelling with Data
Twitter: #SWDChallenge
September 2023: makeover magic
Project Health Viz
Uncover new stories by visualizing healthcare data sets provided each month.
Web: Project Health Viz
Twitter: #ProjectHealthViz
June 2023: Funding for Research for Various Conditions and Diseases
Diversity in Data
An initiative centered around diversity, equity & awareness by visualizing provided datasets each month.
Web: Diversity in Data
Twitter: #DiversityinData
May 2023: Mental Health Awareness Month and LGBTQ+ Representation in film
Sports Viz Sunday
Create and share data visualizations using rich, sports-themed data sets in a monthly challenge.
Web: Sports Viz Sunday
Twitter: #SportsVizSunday
January 2023: Is it a Sport or a Game?
Viz for Social Good
Volunteer to design data visualizations that help nonprofits harness the power of data for social change.
Web: Viz for Social Good
Twitter: #VizforSocialGood
June 9 - July 18, 2023: Gord Downie & Chanie Wenjack Fund
Real World Fake Data
Create business dashboards using provided data sets for various industries and departments.
Web: Real World Fake Data
Twitter: #RWFD
Session 5: Diversity Score Card
Data Plus Music
A monthly project visualizing the data behind the music we love!
Web: Data Plus Music
Twitter: #DataPlusMusic
Historias relacionadas

DataFam Roundup June 2026

DataFam Roundup May 2026

Iron Viz 2026: Read Between the Data
 28 Mayo, 2026