DataFam Roundup: January 22–26, 2024


Welcome! Dig into this week's DataFam Roundup—a weekly blog that brings together community content all in one post. As always, we invite you to send us your content—and the DataFam content from your peers that have inspired you! Find the content submission form here.
Community Highlight
To recognize new and consistent Tableau contributors—we’re excited to have a section within the weekly DataFam Roundup called the Tableau Community Highlight. Find out how to get involved.

Tedy Iskandar, Project Analyst, Indonesia Ministry of Finance
Jakarta, Indonesia
Tedy Iskandar is a Project Analyst at the Directorate General of Customs and Excise - Ministry of Finance, Indonesia. He stays involved in the Tableau Community by participating in community projects including Sports Viz Sunday and Back 2 Viz Basics, and co-leading the Jakarta Tableau User Group.
On Tableau Public, Tedy publishes visualizations on topics like sports, current events, politics, and more. Tedy attributes a lot of his Tableau learning to reverse engineering vizzes on Tableau Public, participating in community projects and leveraging online video content.
Being able to connect and foster relationships both in-person and online with Tableau User Group members has enabled Tedy to grow his Tableau skills in a short period of time. As a Jakarta TUG co-lead, Tedy hopes he can give back by sharing his data knowledge with others.
Connect with Tedy on Linkedin, X, and Tableau Public.
DataFam content
Dive into content created by the Tableau Community:
-
Le Luu: How to extract data from an image file in Alteryx using Pytesseract and CV2.
-
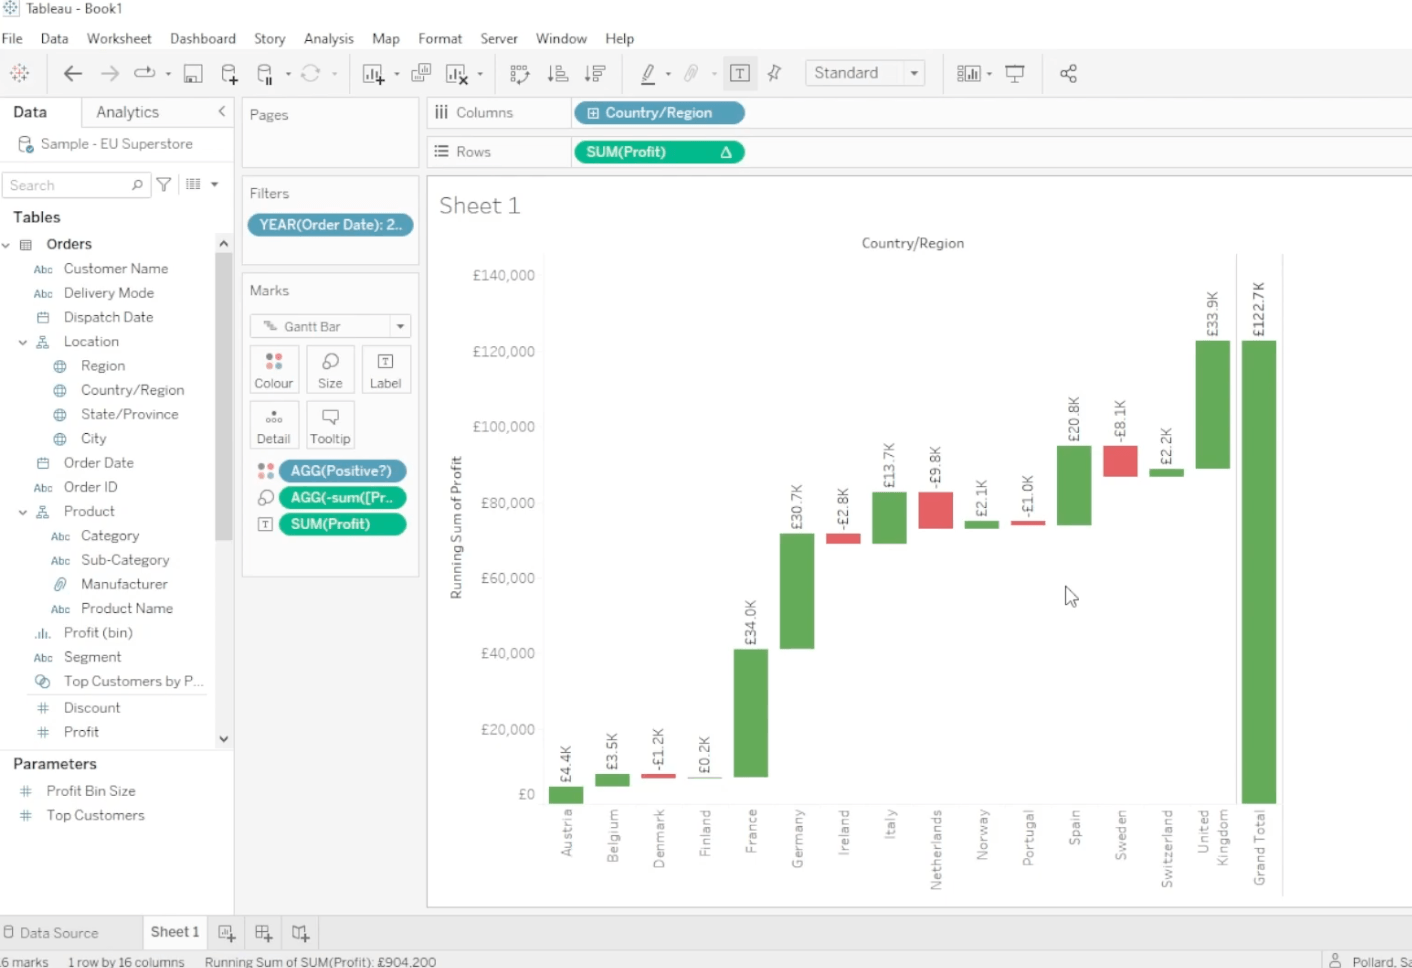
Rather Be Vizzing: Top Tableau Tip | Waterfall Charts
-
Vitaliy Kovalev: How to make Tableau reports faster using Tableau Log Viewer and other tools
-
Alexander Mou: A Preview of Sankey Chart Type in Tableau 2024
-
Rajeev Pandey: Advanced Navigation: Stylising a Menu With Tableau
-
Dawn Harrington: Featured Items From Past Tableau Releases
-
Shreya Arya: Wondering how you can build a better Scatterplot? Here are 6 TIPS to help you get started!
-
Deepak Holla: The different Data Types that are returned when using Date Functions in Tableau
Team Tableau
-
Practice and Grow Your Data Skills with Tableau Community Projects
- Transforming Ideas into Features: Tableau's Commitment to Community-Driven Innovation
- How Victor Muñoz Landed a Data Visualization Gig Using Hire Me
Upcoming events and community participation
-
January 29th Data + Diversity: Celebrating W.E.B. DuBois through Data Visualization: Join us at this virtual event to learn more about the life, legacy and data visualizations of Black American civil rights activist, sociologist and writer W.E.B. DuBois and the annual data visualization challenge.
-
Lights, Camera, Action: Tableau and IMDb Launch Data Visualization Campaign for Movie Lovers
-
READY TO SUPERCHARGE YOUR DATA SKILLS? The Information Lab has free, on demand training courses will help you to make sense of your data and take you from zero to data hero. Developed by our industry leading trainers, our expansive courses cover the basics to intermediate levels of Tableau, Alteryx and Tableau Prep! You can take advantage of the whole course or simply choose the modules you need to brush up on your skills. Start your data journey today by simply selecting your training course below.
-
Demystifying the way to learn Data Visualization! Are you looking for a way to learn Data Visualization and feeling lost? We all have been there and I am going to help you understand the fundamentals and look for a way to learn data visualization.
-
Viz Collab: Hello everyone! I’m excited to be opening #VizCollab back up for another round of matches! In the last year I matched around 40 people for some amazing vizzes, including Viz of the Days and a viz that was featured in a local publication. So if you want to find a collaboration partner sign up.
Vizzes
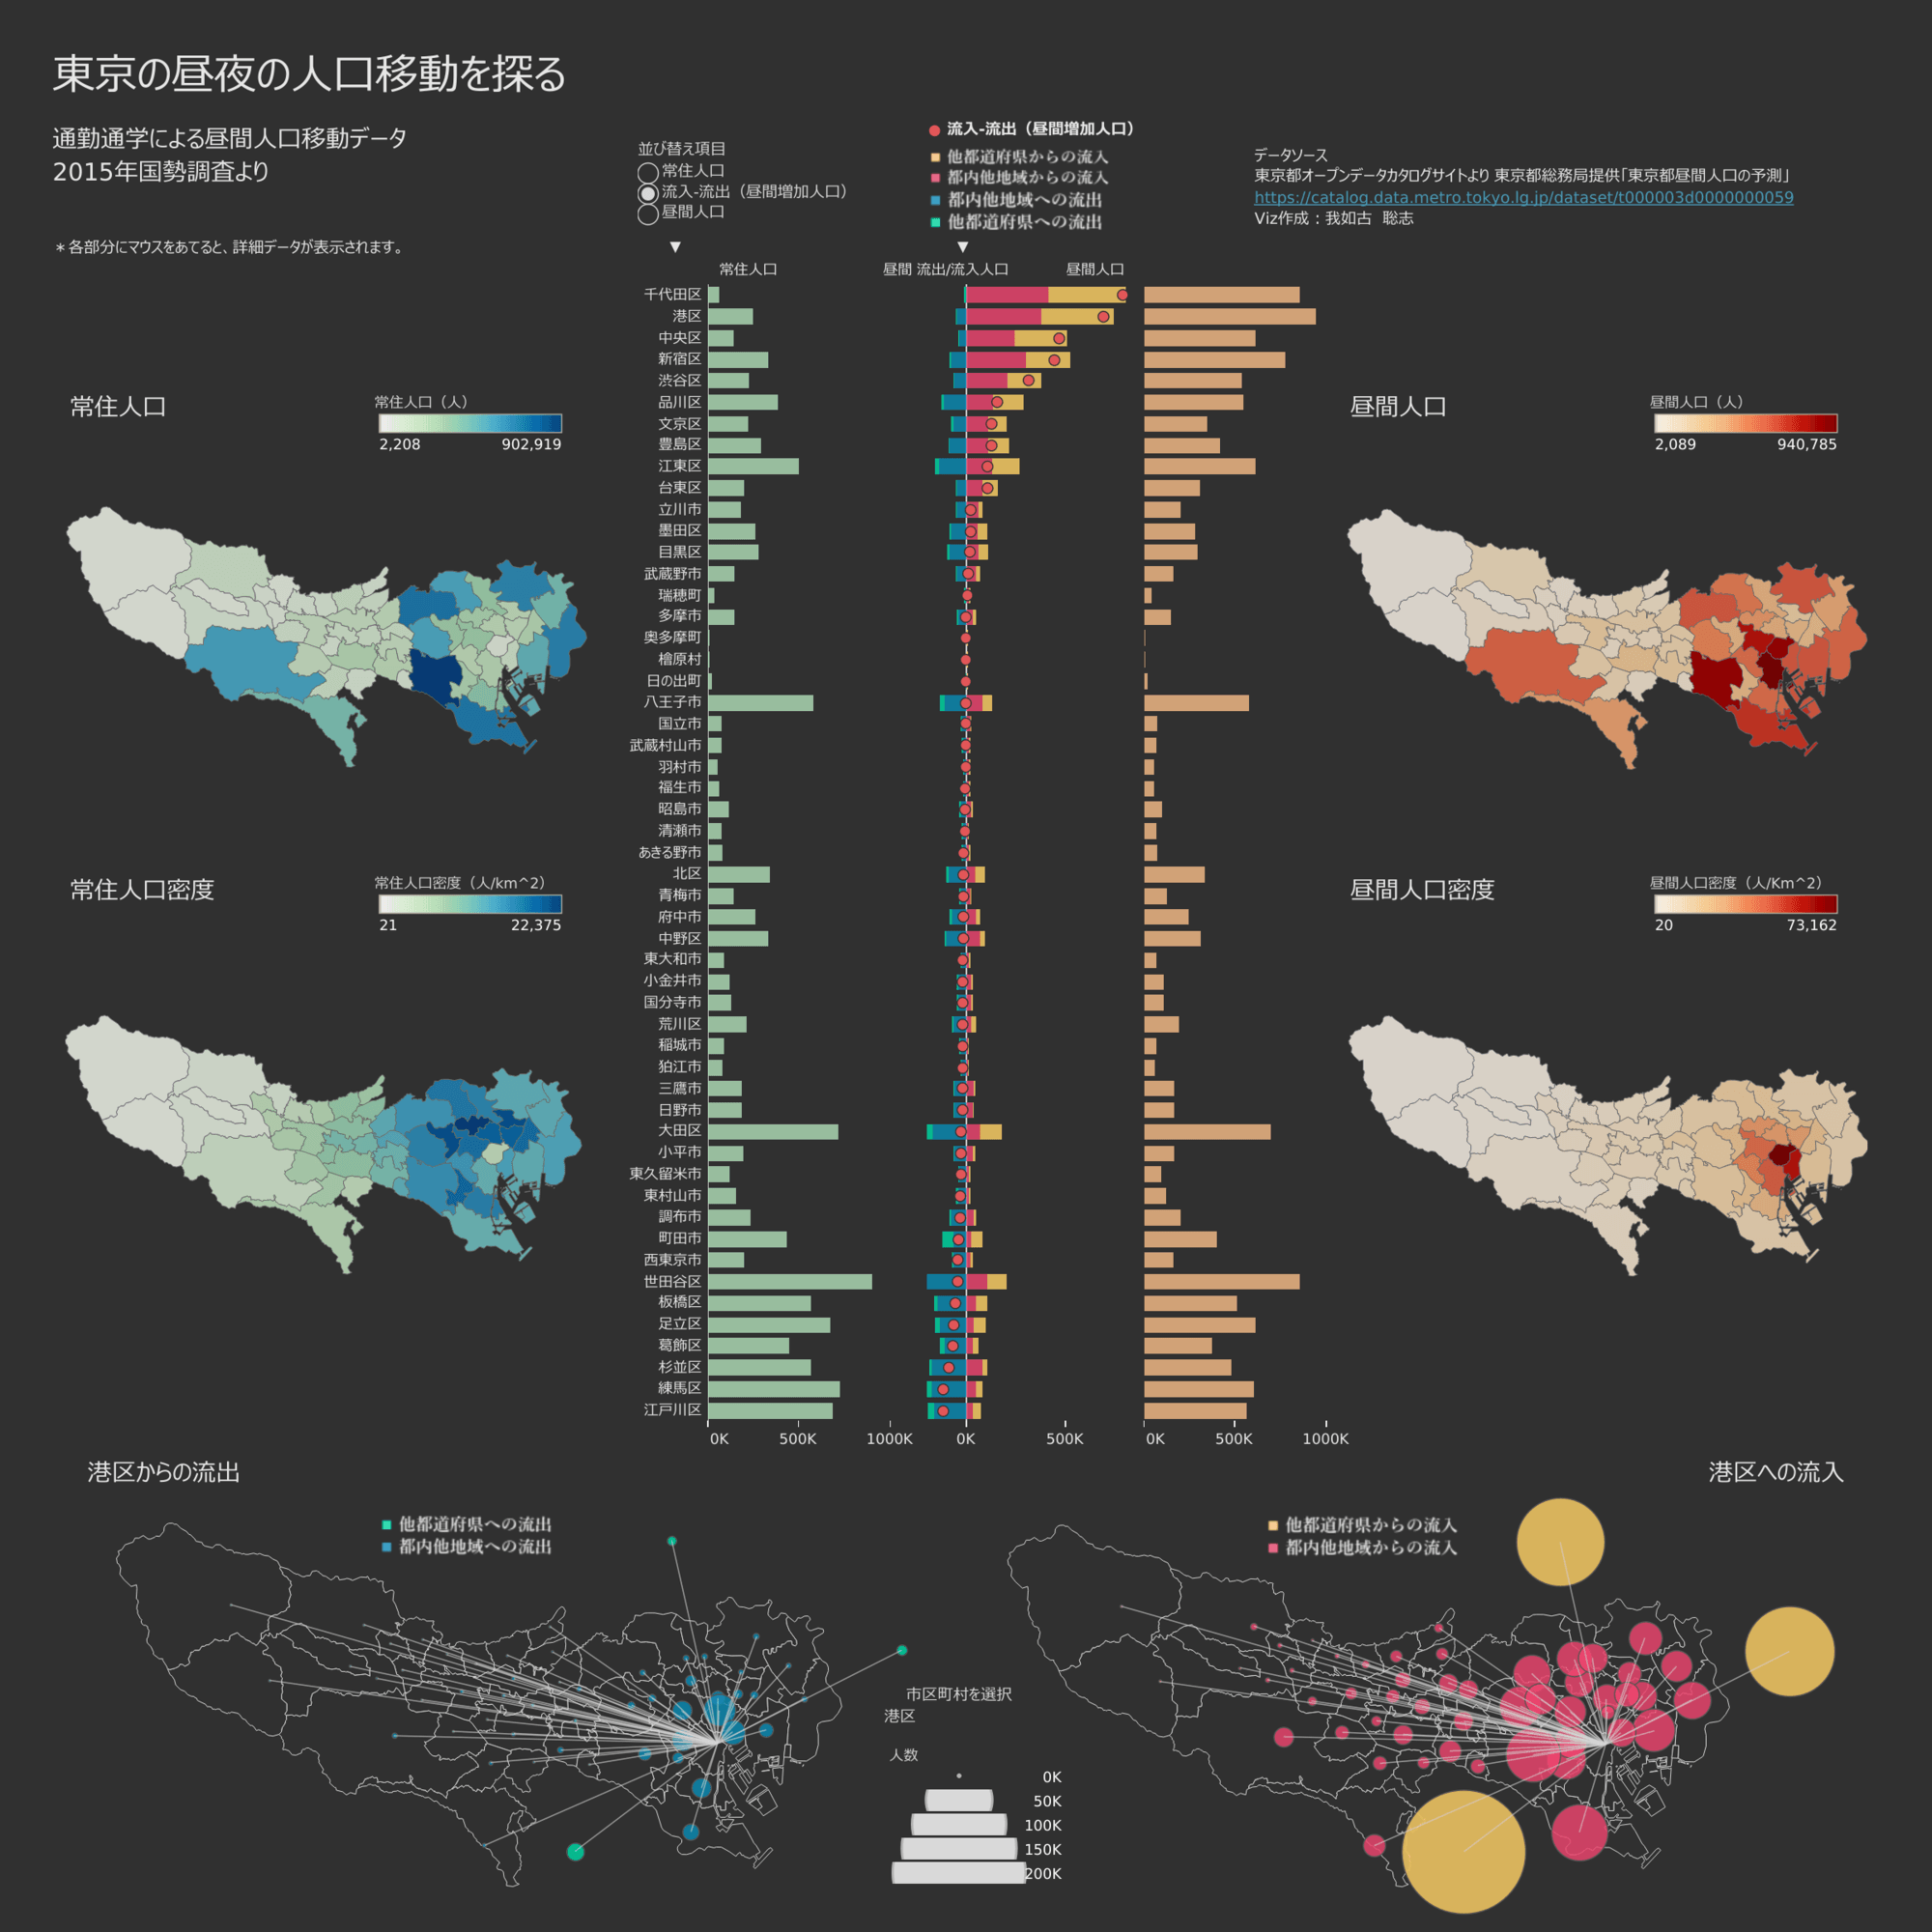
Satoshi Ganeko: 東京の昼夜の人口移動を探る #オープンデータスゴイ
See the latest Viz of the Day, trending vizzes, featured authors, and more on Tableau Public.
Check out some inspirational vizzes created by the community:
-
Adrian Zinovei: Top 50 Athletes Earnings 2023
-
Idris Akilapa: Top 50 Forbes Highest Paid Athletes
-
Rosario Gauna: WOW2024 W04 Can You Create Gauge Charts with Range 0-300?
-
Mehras Abdoli and Ian Cedric lo: The State of School Feeding Worldwide 2022 - EduVizzers
-
Sam Epley: #MakeoverMonday 2024 Week 4: The World's Highest Paid Athletes in 2023
-
Luke Abraham: Japan's Cherry Blossoms | #B2VB Scatter Plot
-
Yoshihito Kimura: #MakeOverMonday W3 Britons New Years Resolutions 2024
-
Ben Norland: Team Styles Dashboard
-
Arshi Saleh: What is Playing on Spotify?
-
Kate Crawford: #MakeoverMonday W4 | Top Earners in Sports
-
Satoshi Ganeko: 東京の昼夜の人口移動を探る #オープンデータスゴイ
-
Tamás Varga: Cherry Tree Flowering at Kyoto City
-
Victory Omovrah: #B2VB Week 1 - Build a Line Chart (Major League Baseball Salaries)
Community Projects
Back 2 Viz Basics
A bi-weekly project helping those who are newer in the community and just starting out with Tableau. Not limited just to newbies!
Web: Back 2 Viz Basics
Twitter: #B2VB
Week 2: Build a Scatter Plot
Workout Wednesday
Build your skills with a weekly challenge to re-create an interactive data visualization.
Web: Workout Wednesday
Twitter: #WOW2022
Week 4: Can You Create Donut Charts Exceeding 100%?
Preppin' Data
A weekly challenge to help you learn to prepare data and use Tableau Prep.
Web: Preppin’ Data
Twitter: #PreppinData
Week 4: Unpopular Seats
DataFam Con
A monthly challenge covering pop culture and fandoms.
Web: DataFam Con
Twitter: #DataFamCon
January 2024: Award-Winning Pictures
EduVizzers
A monthly project connecting real education data with real people.
Web: Eduvizzers
January 2024: The State of School Feeding Worldwide
Games Night Viz
A monthly project focusing on using data from your favorite games.
Web: Games Nights Viz
Twitter: #GamesNightViz
November 2023: Disney's Stacked Bar
Iron Quest
Practice data sourcing, preparation, and visualization skills in a themed monthly challenge.
Web: Iron Quest
Twitter: #IronQuest
White Space
Storytelling with Data
Practice data visualization and storytelling skills by participating in monthly challenges and exercises.
Web: Storytelling with Data
Twitter: #SWDChallenge
January 2024: upskill with UpSets
Project Health Viz
Uncover new stories by visualizing healthcare data sets provided each month.
Web: Project Health Viz
Twitter: #ProjectHealthViz
October 2023: Customizing Shapes with Opacity in Tableau
Diversity in Data
An initiative centered around diversity, equity & awareness by visualizing provided datasets each month.
Web: Diversity in Data
Twitter: #DiversityinData
November 2023: Disney Demographics
Sports Viz Sunday
Create and share data visualizations using rich, sports-themed data sets in a monthly challenge.
Web: Sports Viz Sunday
Twitter: #SportsVizSunday
Viz for Social Good
Volunteer to design data visualizations that help nonprofits harness the power of data for social change.
Web: Viz for Social Good
Twitter: #VizforSocialGood
Real World Fake Data
Create business dashboards using provided data sets for various industries and departments.
Web: Real World Fake Data
Twitter: #RWFD
Session 6: HR Cross-Function Mobility
Makeover Monday
Create business dashboards using provided data sets for various industries and departments.
Web: Makeover Monday
Twitter: #MakeoverMonday
Data Plus Music
A monthly project visualizing the data behind the music we love!
Web: Data Plus Music
Twitter: #DataPlusMusic
Historias relacionadas

DataFam Roundup June 2026

DataFam Roundup May 2026

Iron Viz 2026: Read Between the Data
 28 Mayo, 2026