Data finds a meaningful role in fight against homelessness in the United States


The reasons why someone becomes homeless, and the reasons they might stay homeless, are complex and varied. Difficulty holding a job, family conflict, physical and mental health, or addiction—issues that often compound one another—can all play a role in driving people into the shadowy corners of our communities.

Those shadows exist even in a sun-soaked place like California’s Monterey County, home to some of the country’s most iconic destinations. Towns like Big Sur, Carmel, and Seaside evoke images of luxurious homes along one of California’s picturesque beaches.
However, Monterey is anything but paradise for the county’s homeless population—more than 2,300 men, women, and children by the latest official count. But the data collected by any one social service agency, while valuable, gives an incomplete look at an individual’s circumstances.
Knowing that no single agency could do it alone, Monterey County partnered with the Community Technology Alliance (CTA), a non-profit that is creating the technical infrastructure needed to address issues of homelessness and poverty. Together, Monterey County and CTA created a more patient-centered system that combines data from the 16 different agencies that provide support.
“Looking across the spectrum of services, you can see that these coordinated programs have better outcomes,” said Coalition of Homeless Services Providers Executive Officer Katherine Theoni. “We can start to see predictors of a good program or a bad program, and focus on the things that work well.”
For example, the aggregate data allowed the County to show that coordinated early intervention was enough that 70% of first time clients in transitional housing were only in the system once.
The State of California was so impressed by the program’s effectiveness that it helped Monterey County secure a five year, $13m grant from the Department of Health Care Services for the Whole Person Care pilot program to share what they’ve learned with other counties.
“The better picture we get of the entire community system--not just the homeless service’s sliver of it—the more effective we can be,” Theoni shared.
“We’re able to illustrate things like, say, high-frequency users of medical services, and connect clients with the types of additional services that keep them out of emergency rooms. It is addressing homelessness and being much more cost effective.”
Seeing the big picture
Bringing this data all together is no simple task. The data you find in any homeless management information system is fairly consistent—personal contact information and demographics, where they were last living, history of services received, ongoing and near-term outcomes when that information is available.
However, while the agencies do have a standardized set of metrics they are required to report to the Department Housing and Urban Development (HUD) as a condition of funding, they also have a large number of software vendors supporting the ecosystem—each with its own data formatting and storage structures.
Often, this means each of the potentially dozens of agencies set up their data in different ways. For example, an elemental piece of the data like Client ID was sometimes a six-digit number, sometimes a nine-digit number, and sometimes an alphanumeric string—variations that are a monumental hurdle when you’re trying to asses a person’s use of available services across multiple agencies.
And these data structures are further complicated by additional contextual information that is useful for some types of case managers, but not others: a food bank might track which clients are diabetic, while an emergency overnight shelter may not.
By connecting these silos of data, CTA helps agencies get a clearer understanding of what’s really going on in their communities, allowing case managers to access better information about both individual clients and area trends.
Down but not out—making sense of homelessness data
For homelessness agencies, figuring out what services are more or less effective can have an impact on hundreds of lives. But tracking disconnected and disenfranchised people living on the margins is a monumental challenge.
“The data has traditionally included post-intervention measures like the number of clients served, services provided, and the time each person spends en route to permanent housing,” said CTA CEO Bob Russell. “More recently, the agency has started adding more performance management metrics to the mix to give decision-makers an opportunity to incorporate more data into their daily work.”
However, as the data requests put more of a focus on reaching standardized metrics, agencies were left on their own in the design and analysis frameworks. Without a standard for organizing and analyzing the data, apples-to-apples comparisons across agencies—even in the same city—were difficult.
CTA’s role is in normalizing that data and visualizing the findings. They started by creating data templates in excel that any agency can use on its own to restructure existing data into a standardized format regardless of the underlying system. From there, CTA can aggregate data across agencies, providing both 360 views of the client experience and identifying trends across the area.
Using insights to improve services

Insights from data can be used for more than funding; the data can help agencies focus resources or improve clients’ services to be more effective and cost-efficient.
This potential is why Tableau Foundation and CTA launched a nationwide Data Fellowship to teach—and learn—about the different ways standardized data could lead to better outcomes across the country.
Throughout the series of trainings, all of which were facilitated pro bono by Tableau partner Interworks, Fellows quickly transformed into co-creators with CTA staff and established new dashboards to be used network-wide.
Helping agencies help people
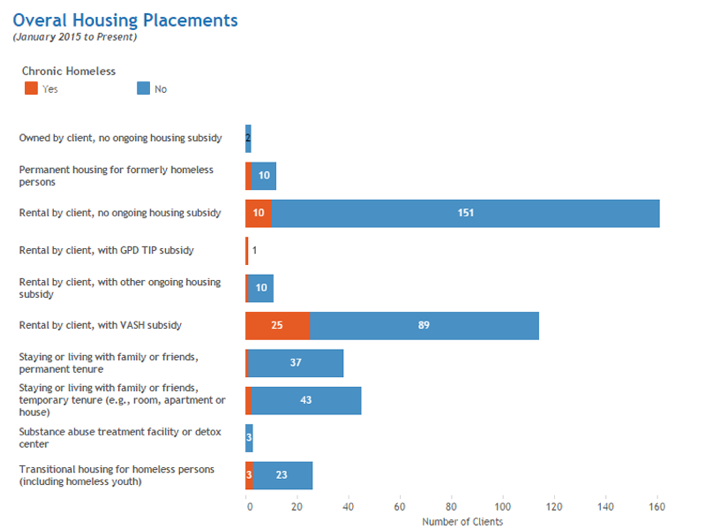
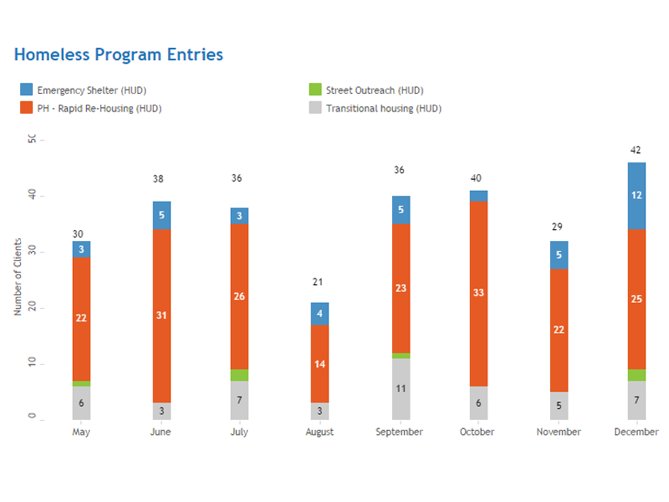
On the heels of that effort, CTA has built a platform to extract, reshape, and open up data for collaboration without compromising the privacy of individual clients. Simple in its design, the data portal makes it easier for agencies to match the needs of people coming into the system with programs that have successfully moved—and kept—people into a stable living situation.
The platform uses the Tableau Online Javascript API to wrap a Wordpress site around the dashboards, giving CTA an opportunity to customize the experience to the needs of agency staff. On the top level sits the high level stats that are required reporting for HUD. From there, CTA staff can drill down into dashboards that explore the agency’s data in that specific area.
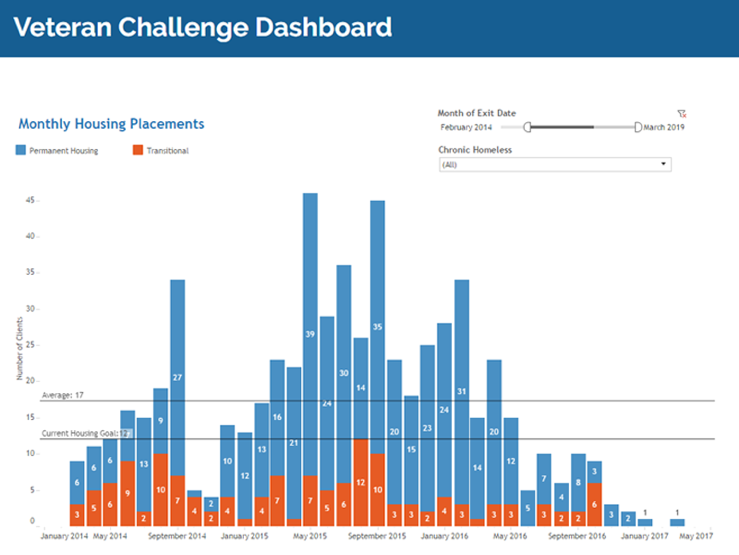
Building the system in collaboration with the Fellows, CTA was able to keep the needs of the user at the heart of the process. For example, Elizabeth Botkin in the Baltimore, MD’s Mayor’s Office of Human Services created a Veteran Challenge Dashboard to dig into the specific performance around veterans’ issues and services.
Andrea Curry in Red Bluff, California developed a dashboard that looked at the income that homeless people either gained or earned while part of a service program.
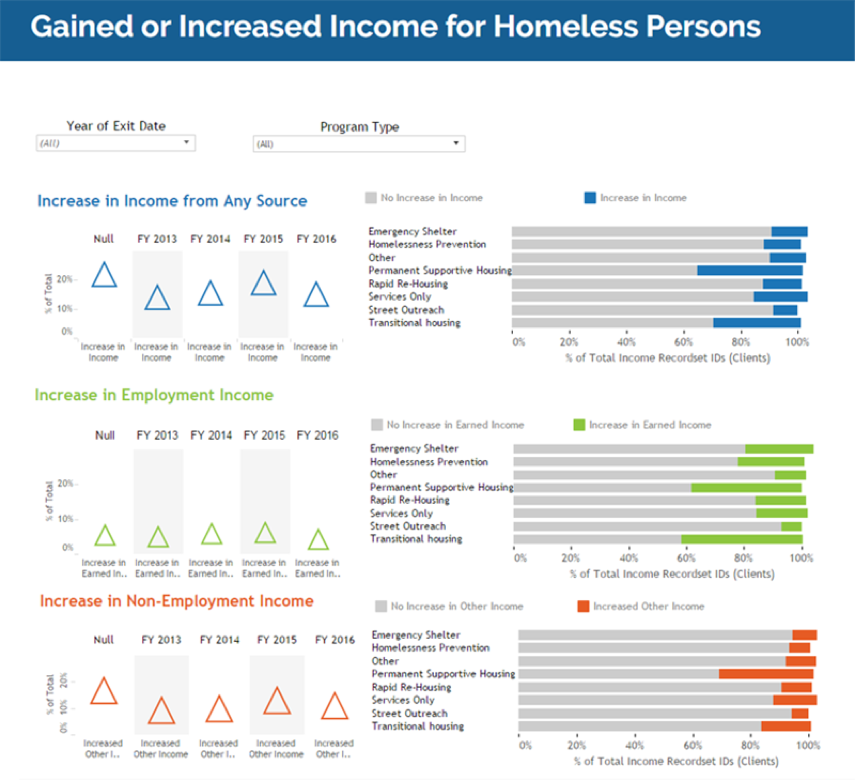
“There is a certain set of HUD outcome measures that we are required to report and the HMIS are set to pull out that data, but they’re not really informative at an administrative level,” said Curry. “I wanted to track client’s ability to have some sort of earned income because it is so important to getting and keeping people housed.”
Data lets agencies challenge assumptions and redirect resources
For practitioners and policy makers, the assumption had always been that Permanent Supportive Housing–subsidized housing that allows formerly homeless individuals and families to live as independently as possible--would be useful for helping folks enroll for Supplemental Security Income, but would not lead to much of a change in job-related earnings. When the data disproved that assumption, Curry made the case to her agency not to skimp on the employment-related services for those in Permanent Supportive Housing. The result was a continued increase in the number of people able to earn enough to support themselves and move out of the system all together.
For Curry, the data is changing conversations with country leaders from if we should help to how we should help.
The dashboard looks at three different incomes—any income, employment income, and non-employment income. Some of what the data showed was expected, like disabled people without an employment-based income fared better in Permanent Supportive Housing than those in Emergency Shelters.
But what surprised Curry was that Permanent Supportive Housing is more effective in helping people increase employment-based income, too.
“[Local officials] able to see and better understand the problem, which helps them see their self-interest in helping,” she said. “For the County, it is not just the right thing to do morally, but also financially."
This goes back to a word CTA’s Russell often uses when he talks about the role of data in helping end poverty and homelessness—meaningful.
Performance metrics are only meaningful if they result in people being able to live their lives with a degree of self-sufficiency, dignity, and purpose. If the agencies that make up our first line of support do not meet those outcomes, then we all have more work to do.
Historias relacionadas
From Kidney Donation to Tableau Dashboard
 25 Octubre, 2022

Using data to drive conversations about climate change
 28 Abril, 2022