

Measured informs smarter D2C media investments with Tableau Cloud
With Tableau, Measured creates new product experiences 10 - 20x faster than traditional UI development
Rapid creation of client-specific dashboards addresses the unique queries and needs of each brand
Ease of product extensibility allows brands to see Tableau data in workflows that match their existing tools
Brands that spend heavily on their digital marketing campaigns want the best return for their investment—not just increased sales, but also directional visibility on which of their tactics are most effective. With finite resources and an ever-evolving online consumer mindset, it's more important than ever for a brand to spend its marketing dollars wisely.
California-based Measured provides analytics to direct-to-consumer (D2C) brands that help each brand understand the efficacy of their advertising spends, in both online channels like Facebook and offline channels like direct mail. Unlike other analytics providers that track static performance factors like last-click and multi-click attribution which have limitations, Measured uses a test and control methodology to inform media incrementality when in the converting path producing transparent, accurate and precise marketing analysis for making better media investment decisions.
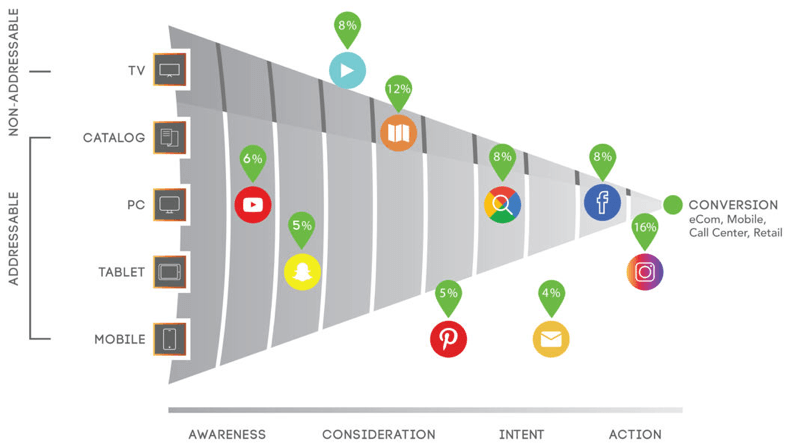
Fig. 1. Measured helps D2C brands visualize the incremental impact of paid media marketing investments.
To bring this incremental analysis to their clients, Measured builds dashboards on Tableau Cloud that can be easily accessed by each client within their Measured experience. These dashboards provide detailed analysis and recommendations for ways each brand can examine paid media performance and optimize their total spend.
Overcoming the burdens of custom UI development
Measured's cofounders, CEO Trevor Testwuide and CTO Madan Bharadwaj, previously worked at companies that consulted with brands, analyzed their marketing spends, and delivered reports and bespoke UI experiences that were limited in customization and forced users to download data into Excel. The process was effective, but ultimately inefficient. Preparing and querying Excel spreadsheets was a highly manual process, and it was disconnected from the source data, making each report partially out of date as soon as it was finished. And building a separate online data interface for each client to meet their specific needs meant that development slowed down the rate at which each brand client could achieve value with the data.
And so Measured was born in 2017, and currently serves timely, insightful data to hundreds of stakeholders at more than twenty-five D2C brands on the incremental contributions of their paid media tactics—all through the familiar and easy-to-use functionality of the Tableau platform.
"Many of our clients in the past have been familiar with Tableau, and would ask if we could give them our insights in the form of workbooks they could use right in their Tableau environments," says Testwuide. "So it just made a lot of sense for us to stop burning our resources building a bespoke, custom UI for every client, when we could accelerate our own application by partnering with Tableau."
For a startup like Measured, this approach had several key advantages. One of the biggest was time to market—the Measured team rapidly creates new product experiences using the capabilities of the Tableau platform 10 - 20x faster than traditional UI development approaches. In addition, customers can spin up their own bespoke dashboards on top of the Measured dataset within hours without all the disadvantages of “Excel-hell”.
In this way, Measured bridges the gap between standard reporting and more specific, business-driven requirements. "There's always the 80/20 rule," Bharadwaj says. "A standard analytics product experience will cover about 80 percent of a client's use cases, but the remaining 20 percent will be very diverse. And because each of our D2C brand clients has a unique business model, that 20 percent is where they generally spend 80 percent of their time. So, we implement Tableau in ways that extend the customer's product experience to include these more distributed use cases, and that way they get everything they need in one place."
Capital efficiency was also optimized, in that Measured could focus resources on its core applications rather than building a customized UI for every client.
"Our challenge was to commit to a product experience from within Tableau, which was a radical approach in market for our category" says Bharadwaj. “But once we got comfortable with that idea, Tableau brings a lot of what you’d want in a UI product like navigation, objects like worksheets, dashboards, an object hierarchy, events, scripting - all out of the box.” And because its target market had proficiency with Tableau already, Measured could deliver workbooks that easily integrated into each client's workflows without disrupting work or requiring further training.
Tableau brings a lot of what you’d want in a UI product like navigation, objects like worksheets, dashboards, an object hierarchy, events, scripting - all out of the box.
Pivoting on product extensibility to ease client adoption and integration
To maximize the value Measured provided to brands, ease of use and stakeholder adoption were an essential focus. Having streamlined its process for developing rich, unique user experiences for its clients, Measured wanted to further improve usability and drive adoption by providing these experiences from within the analytics products the clients were already using.
By providing Tableau dashboards that surface the data analytics in ways that look and feel just like the client's preferred toolset, and then supplementing with new applications that facilitate further data entry and manipulation, Measured gives each client a rich experience that maps to what they already know.
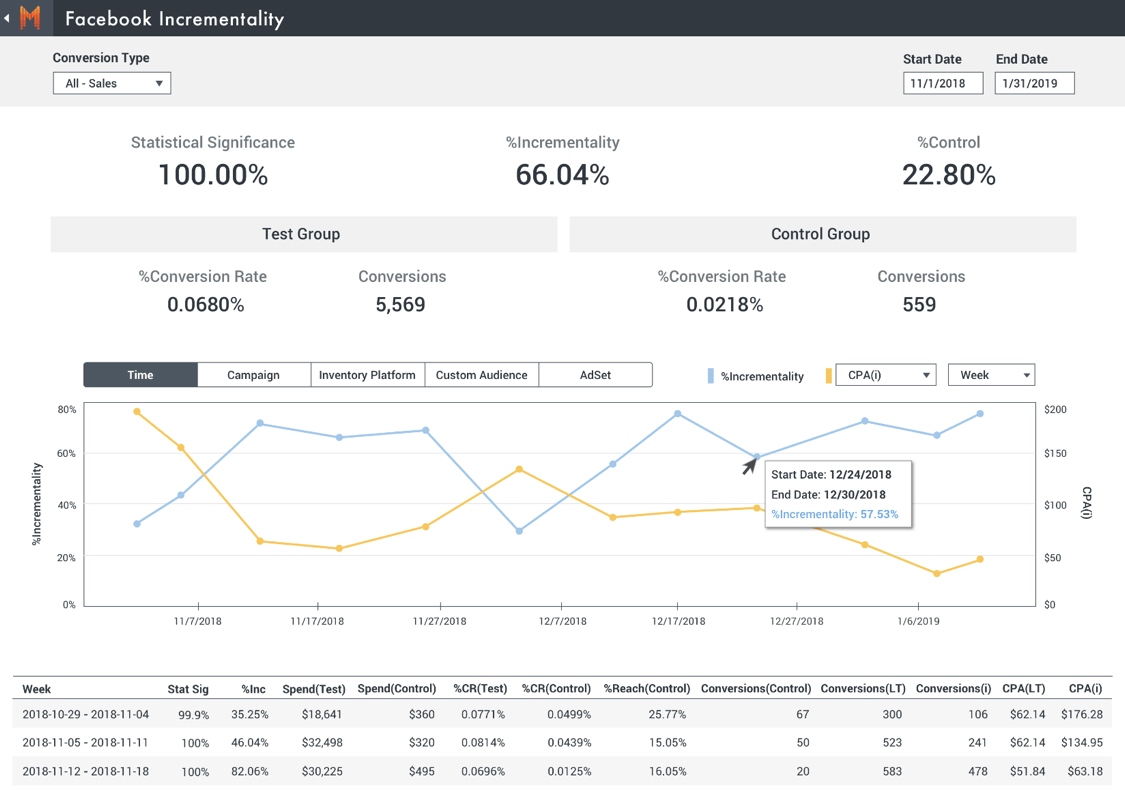
Fig. 2. Example dashboard, embedded in an existing product UI and easily optimized for the client's specific questions and needs.
Getting to this experience, Bharadwaj points out, means putting in the work up front to gain a clear understanding of the client's specific business needs. "There's probably more than 100 metrics we can derive from a standard data set. What makes a client unique is figuring out the four or five metrics they care about most for their business. Once we know what those are, we can start to build the experience they need."
This extensibility approach to integrating Tableau with the client's daily experience goes a long way to get people using the Tableau platform and its data as part of their everyday work. Adoption is diverse at Measured's clients, ranging from data scientists and analysts to senior executives and marketing optimization personnel. Each one uses the platform in their own way, for specific business purposes. The flexibility of creating dashboards to meet each stakeholder's needs means each client can maximize the value Tableau adds in their environment.
"The ease of customization we get with Tableau allows us to align our interface with the unique requirements of each customer," says Testwuide. "When we do that, it drives much higher rates of adoption, informs high value decisions with our analytics, and helps the client win with our technology."
The ease of customization we get with Tableau allows us to align our interface with the unique requirements of each customer.
Success story: Doubling profits in 18 months at Johnny Was
One of Measured's recent success stories is the work they did for Johnny Was, a women's clothing and accessories brand with more than 30 stores across seven US states. With a mandate to grow its ecommerce sales channel by tenfold in five years, it sought Measured's help in identifying the best composition of paid media allocations that would optimally scale its tactics and drive new customer acquisition.
Measured worked with the brand to identify the specific analytics queries that would yield solid directional guidance, and then deployed the Measured cross-channel incrementality measurement framework to get a clear picture for the first time of how marketing spend performed in each channel. Using net profit as a primary growth metric, the Measured framework gave Johnny Was a new way to measure the marginal impact on net profit of each tactic, and use this information to plan the best ways to scale, cut, and maintain its investments.
In the first 12 months of implementing Measured with Tableau Cloud, Johnny Was profitably scaled into five new digital tactics, using guidance that was proven by Measured to be directionally sound. It strategically increased its Facebook spend by 30x, scaled its catalog prospecting, and right-sized its retargeting investments, all using Measured insights and aimed squarely at meeting the brand's stated incremental net profit increase objectives.
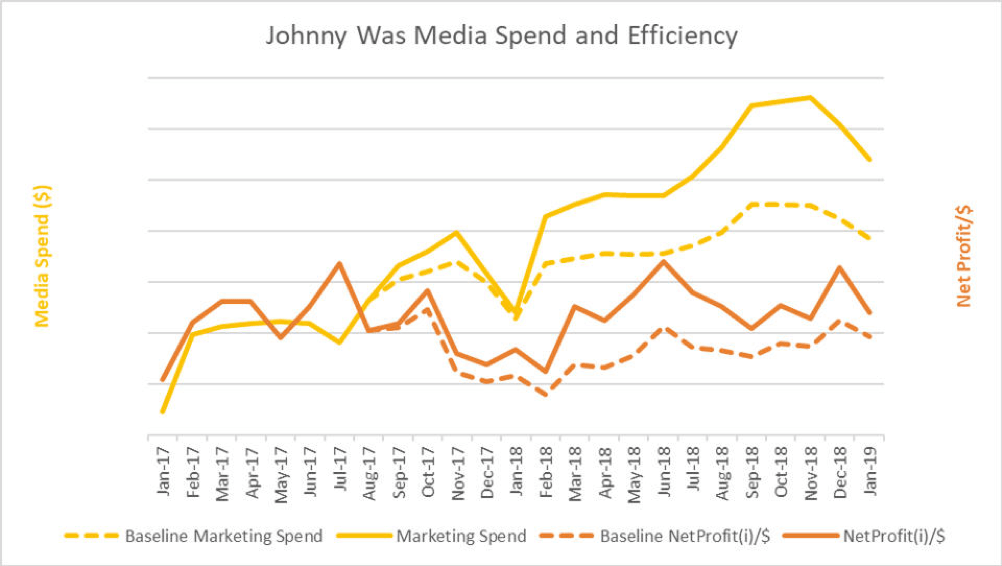
Fig. 3. Detailed correlation of media expenditures to net profits for example Measured client Johnny Was.
With insights from Measured, Johnny Was doubled its online business in 18 months. The brand aggressively scaled its budget to a 177 percent increase during that period, confident in their decision making and newly bolstered by the visibility into their cross-channel approach. At the same time, the brand improved its marketing efficiency by 24 percent in terms of net profit versus spend. The last month of the period was December 2018, which was their best month ever for profits, and which represented an 84 percent gain in marketing efficiency year-over-year.
Like many of Measured's clients, Johnny Was drew positive insights from the experience, including:
• Better measurement enables better decisions
• Incremental measurement clarifies each media tactic's contribution to the business
• A media mix driven by incremental measurement can promote huge growth for a D2C business
With the Tableau platform powering these insights and delivering a user experience to stakeholders at Johnny Was that was integrated with their daily work, the brand is on its way to achieving its 5-year, 10x sales growth goal.
About Measured
Measured is a cross-channel marketing data platform driving advanced intelligence and media investment decisions for direct-to-consumer brands. Its cross-channel reporting and decision guidance helps growth-focused brands inform the true incremental contribution of paid media tactics so they can refine their profitability strategies and achieve their long-term goals.