How Illinois’ largest healthcare system transformed patient safety—and how you can, too
Today’s guest blogger is Slalom Consulting, who is just as excited to be at the Gartner BI Summit in Las Vegas next week as we are. Will you be there too? Then don’t forget to stop by booth #217 to talk data with Tableau, or check out Slalom Consulting at booth #115.


Today’s guest blogger is Slalom Consulting, who is just as excited to be at the Gartner BI Summit in Las Vegas next week as we are. Will you be there too? Then don’t forget to stop by booth #217 to talk data with Tableau, or check out Slalom Consulting at booth #115.
Slalom Consulting is a Strategic Alliance Tableau Partner. They deliver award-winning business intelligence solutions and innovation through a national network of local offices across 14 North American cities. And with more than 2,000 consultants, they help companies of all sizes, from the Fortune 500 to emerging businesses. If you are attending the Gartner BI Summit next week, don’t miss out on their excellent session, “How analytics and data visualization can transform patient safety.” This post features some of the highlights of that session:
How analytics and data visualization can transform patient safety
In a joint presentation at the Gartner Business Intelligence Summit in Las Vegas on March 31, we’re joining forces with Advocate Health Care to talk about the approach, challenges, lessons, and impact of providing the right people with the right data in the right format for your organization. We’ll share how analytics and data visualization transformed patient care and safety for Advocate, and how it can empower your organization, too.
Increasing compliance, improving care
Advocate is the largest health system in Illinois and one of the top ten largest healthcare systems in the country. In the healthcare system, whenever a provider initiates care for a patient—such as an X-ray, lab test, or prescription—an order is placed. After decades of providers scribbling down care orders by hand, many healthcare systems have made the shift to computerized provider order entry (CPOE), which has proven to eliminate errors, standardize care, improve efficiency, and reduce costs.
To provide the best patient care and exceed regulatory standards, Advocate needed to maximize its investment in its Electronic Health Record (EHR) system. Doing so meant increasing CPOE compliance to better than 80% and eliminating order entry errors entirely. After a concentrated effort on user adoption resulted in little change, Advocate enlisted Slalom’s Information Management and Analytics expertise to conduct a data deep-dive and develop a strategy for CPOE compliance improvement.
Data visualization leads to eye-opening results
Together, Slalom and Advocate decided to focus the initial analysis on just one of Advocate’s 12 hospitals. Slalom started by pulling millions of rows of raw data and visualizing it in Tableau. Immediately, the Advocate Clinical Informaticists were able to recognize trends—with unexpected results. Our deep data analysis revealed that existing processes had been negatively impacting Advocate’s compliance.
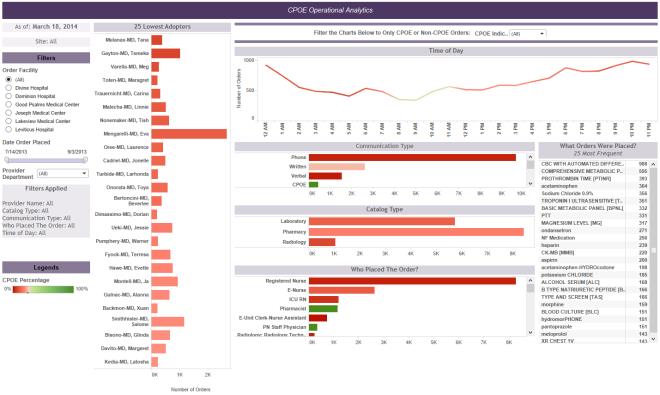
The Tableau solution gave Advocate’s Clinical Informaticists the ability to interact with their data as never before. Many expressed that this view was a real eye-opener, arming them with the insights they needed to actually make a measurable difference to CPOE compliance. They can now look at data at a high level; identify potential problem areas; and isolate the root cause of issues. Delivering insights through Tableau data visualization empowered the hospital staff with easy access to pared-down information, enabling decision makers to make the necessary process and policy changes to ultimately improve patient care.
Join Tableau, Slalom, and other data enthusiasts at the Gartner BI Summit (3/31-4/2) for some analytical fun. You can join Tableau by:
- Visiting booth #217 to chat with a Tableau team member and see a live demo anytime during the exhibit show hours.
- Grabbing lunch and learning from the session “Building an Analytical Culture at Janssen Pharmaceutical,” presented in room Lando 4201B (11:45 AM–12:30 PM on Monday, 3/31).
- Talking Data with us at the Tableau Speakeasy Lounge in room Marcello 4405 (5:30PM–7:30PM on Tuesday, 4/1).
We hope to see you all there!