DataFam Roundup: March 11–15, 2024


Welcome! Dig into this week's DataFam Roundup—a weekly blog that brings together community content all in one post. As always, we invite you to send us your content—and the DataFam content from your peers that have inspired you! Find the content submission form here.
Community Highlight
To recognize new and consistent Tableau contributors—we’re excited to have a section within the weekly DataFam Roundup called the Tableau Community Highlight. Find out how to get involved.

Egor Larin, BI Lead at Toloka
The Netherlands
Egor Larin is the BI Lead at Toloka. He learned Tableau through technical challenges and trial and error. As a Russian speaker, Egor was pushed to learn through more hands-on methods due to the language barrier. Egor is now a veteran of the Moscow Tableau User Group and has recently gotten involved in the Netherlands Tableau User Group and VizIt. He is also active on Tableau Public where he publishes vizzes on topics that personally interest him or address problems he wants to solve.
As an advocate for the Russian-speaking Tableau Community, Egor has led the charge in hosting events and providing resources to this group. Recently, he organized an event on the community platform, Telegram, with more than 3,000 attendees across the world.
Connect with Egor on Linkedin, X, and Tableau Public.
DataFam content
Dive into content created by the Tableau Community:
-
Mark Bradbourne: Real World Fake Data ~ Season 3
-
Chris McClellan on LinkedIn: #datafam
-
Octo Knot(オクトノット)|MUFGは情報系分析基盤をいかに浸透させたか? データ利活用促進のためのTableau導入の実際
-
Bitfern: Transform field per line data with Tableau Prep (2)
-
Adam Mico:
-
Toan Hoang:
-
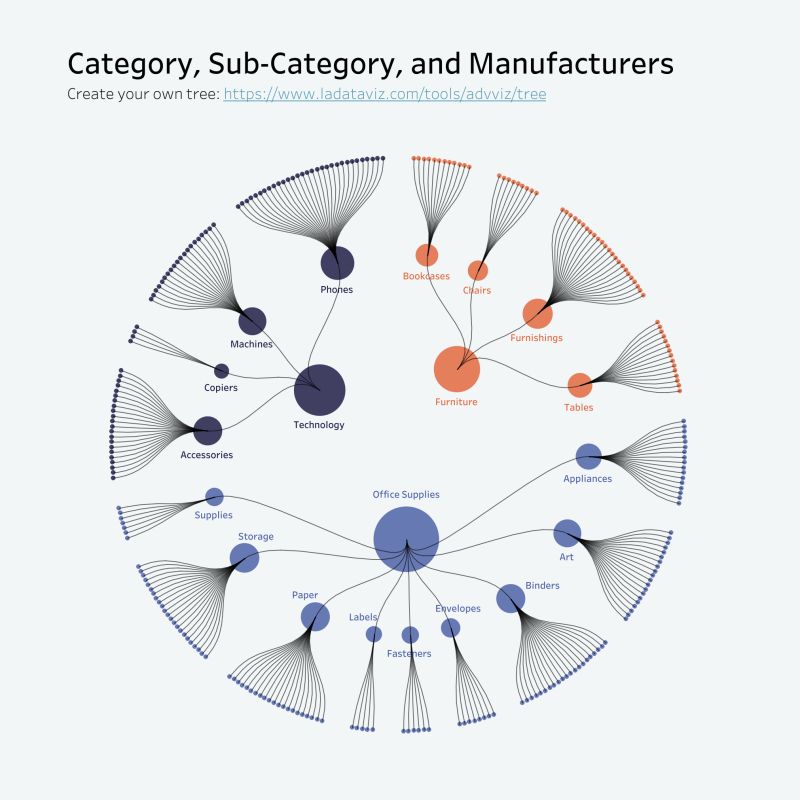
Tristan Guillevin, La Data Viz: Build Trees Tableau in one click!
-
Will Sutton: How to extract data files from Tableau Workbooks superfast!
-
Tabitha Diaz: How to document your Tableau workbooks
-
Bryce Larsen: Tableau Server Permission Icons
-
Nate Mayfield, The Data Leadership Collaborative: 5 Ways to Lead with Data
-
Christy O’Gaughan, The Data Leadership Collaborative: 7 Data Leader Best Practices for AI Success
-
Eric Balash, Data Afterhours: Episode 1 Bo McCready
-
Deepak Holla: Possible Options Of Creating Data Sources in Tableau Desktop
Team Tableau
-
How to grow your data skills with Tableau Community Projects | DataFam Explained
-
Hit the trails with the new Tableau Hands-On Challenges on Trailhead. Get hands-on experience and real-time feedback as you create new vizzes and build your Tableau Public portfolio, for free! To get started, log in or create a Trailhead account and explore one of these 5 new badges:
-
Data Storytelling with Tableau Public - Visualize data on any topic, share your data story worldwide, and get inspired.
-
The Tableau Data Model - Load your dataset and create relationships between tables.
-
Metadata Management in Tableau - Prepare a Tableau dataset with well-managed metadata.
-
Detailed Data Analysis - Ask questions and configure visuals to communicate insights.
-
Data Presentation in Tableau - Build dashboards in Tableau that guide stakeholders through critical analysis.
-
Upcoming events and community participation
-
Data Lead[HER]: Shaping the Future of Data & AI Join us for a virtual event in March, Women's History Month, designed to empower and elevate women leaders in the data and AI space. This program will feature insightful discussions and actionable strategies from women in leadership.
-
Lights, Camera, Action: Tableau and IMDb Launch Data Visualization Campaign for Movie Lovers
-
2024 Vizzies Award Nomination: The Tableau World Podcast established the Vizzies as a way to recognise individuals in the Tableau community who are not recognised through the visionary program. It is our goal that these awards are diverse and inclusive of the Tableau community.Without further ado, we present the 9th Annual Vizzies.Nominations are open now through March 25th 11:59pm EST. Winners will announced live on stage at TC24!
Vizzes
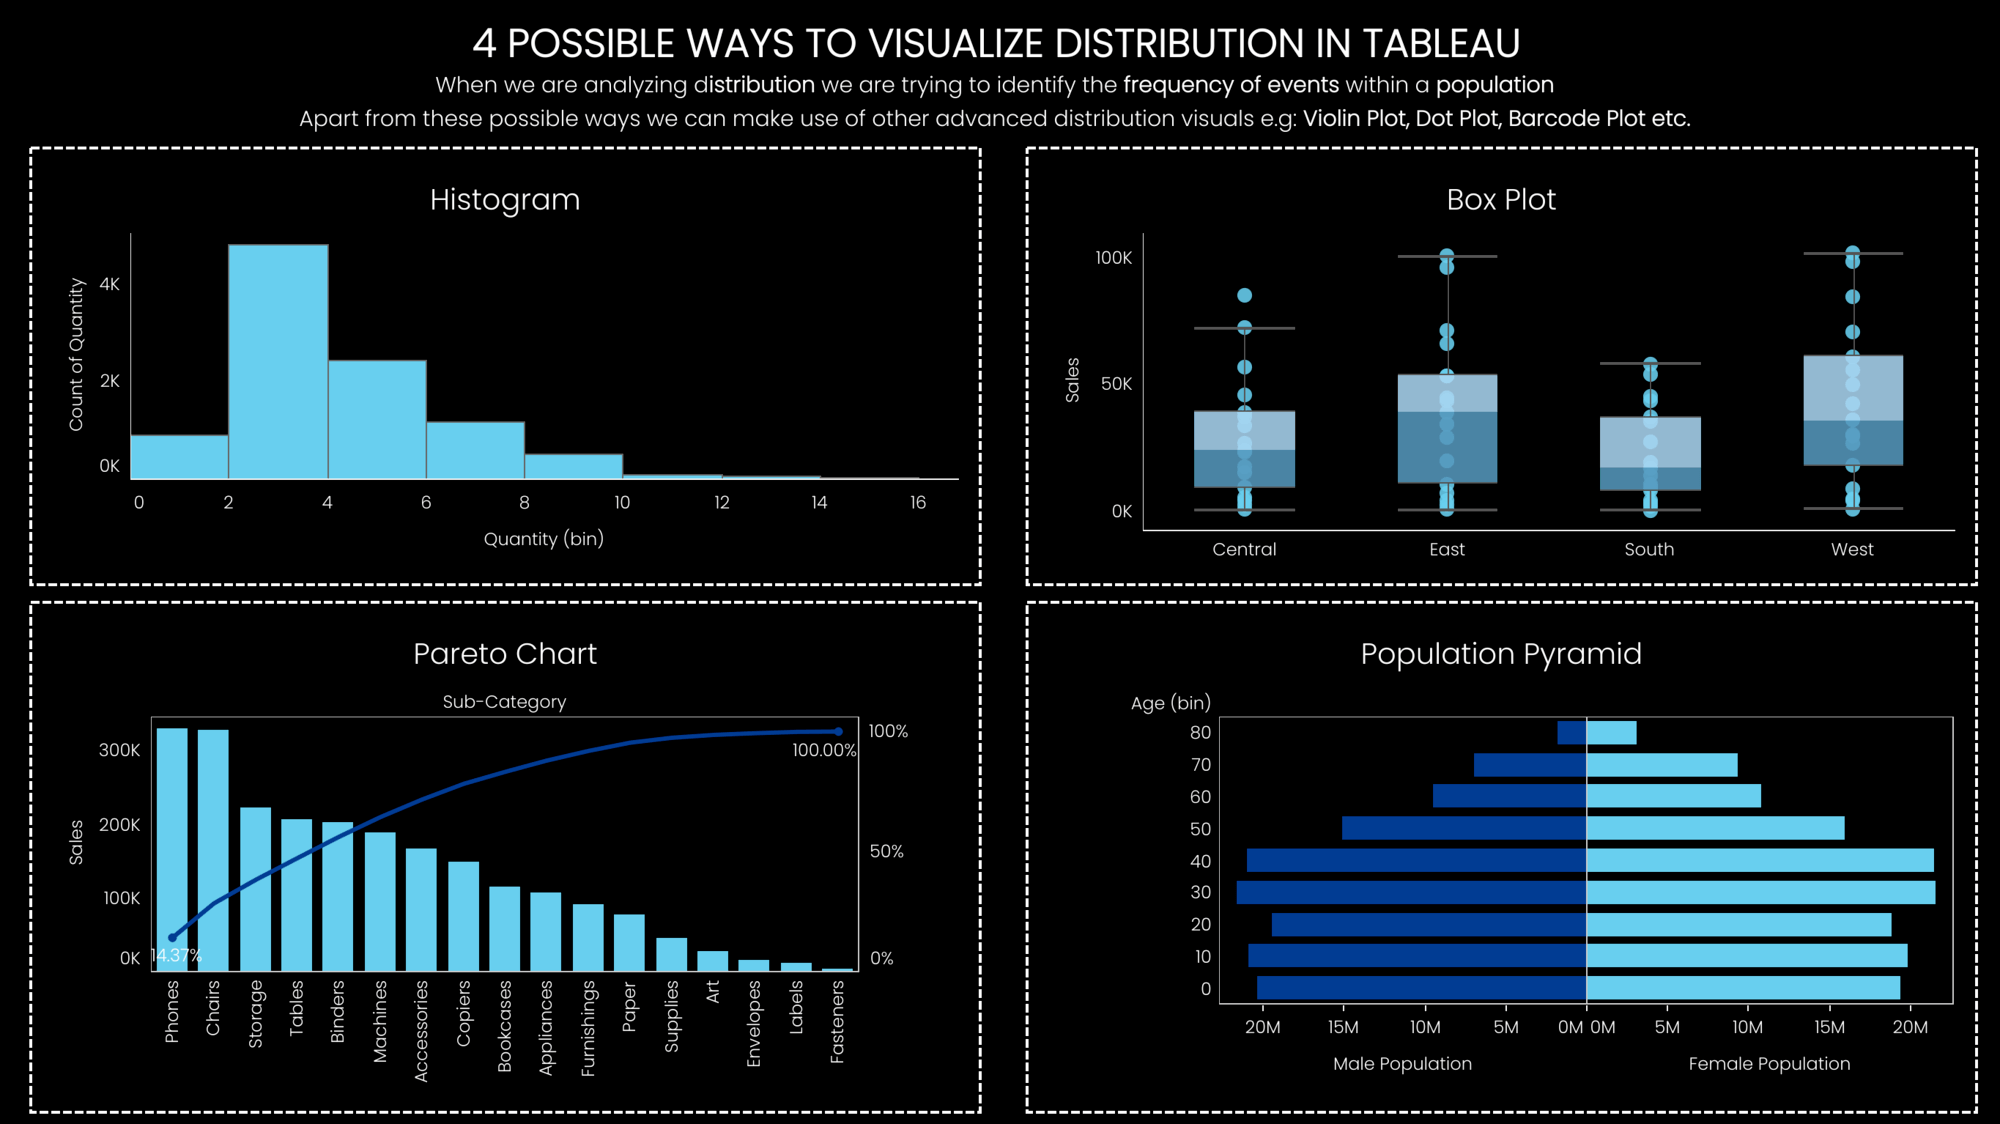
Deepak Holla: 4 Possible Ways to Visualize Distribution in Tableau
See the latest Viz of the Day, trending vizzes, featured authors, and more on Tableau Public.
Check out some inspirational vizzes created by the community:
-
Deepak Holla: 4 Possible Ways to Visualize Distribution in Tableau
-
Tamás Varga: Vacant Household Rates in the US
Community Projects
Recreations of W.E.B Dubois's Data Portraits
Recreations of W.E.B Dubois's Data Portraits
Web: W.E.B. Dubois's Data Portraits
Twitter: #DubiosChallenge
Back 2 Viz Basics
A bi-weekly project helping those who are newer in the community and just starting out with Tableau. Not limited just to newbies!
Web: Back 2 Viz Basics
Twitter: #B2VB
Week 5: Play with Size
Workout Wednesday
Build your skills with a weekly challenge to re-create an interactive data visualization.
Web: Workout Wednesday
Twitter: #WOW2022
Week 11: Can you filter a Small Multiples chart?
Preppin' Data
A weekly challenge to help you learn to prepare data and use Tableau Prep.
Web: Preppin’ Data
Twitter: #PreppinData
Week 11: 13 months in a year
DataFam Con
A monthly challenge covering pop culture and fandoms.
Web: DataFam Con
Twitter: #DataFamCon
March 2024 Challenge: Sports Movies Edition
Makeover Monday
Create business dashboards using provided data sets for various industries and departments.
Web: Makeover Monday
Twitter: #MakeoverMonday
Week 11: Vacant Household Rates in the United States
EduVizzers
A monthly project connecting real education data with real people.
Web: Eduvizzers
March 2024: Teacher Loan Forgiveness
Games Night Viz
A monthly project focusing on using data from your favorite games.
Web: Games Nights Viz
Twitter: #GamesNightViz
Season 2: With great power comes great vizzes
Iron Quest
Practice data sourcing, preparation, and visualization skills in a themed monthly challenge.
Web: Iron Quest
Twitter: #IronQuest
Women
Storytelling with Data
Practice data visualization and storytelling skills by participating in monthly challenges and exercises.
Web: Storytelling with Data
Twitter: #SWDChallenge
March 2024: design for accessibility
Project Health Viz
Uncover new stories by visualizing healthcare data sets provided each month.
Web: Project Health Viz
Twitter: #ProjectHealthViz
October 2023: Customizing Shapes with Opacity in Tableau
Diversity in Data
An initiative centered around diversity, equity & awareness by visualizing provided datasets each month.
Web: Diversity in Data
Twitter: #DiversityinData
November 2023: Disney Demographics
Sports Viz Sunday
Create and share data visualizations using rich, sports-themed data sets in a monthly challenge.
Web: Sports Viz Sunday
Twitter: #SportsVizSunday
Viz for Social Good
Volunteer to design data visualizations that help nonprofits harness the power of data for social change.
Web: Viz for Social Good
Twitter: #VizforSocialGood
Real World Fake Data
Create business dashboards using provided data sets for various industries and departments.
Web: Real World Fake Data
Twitter: #RWFD
2024 - Admin Insights
Data Plus Music
A monthly project visualizing the data behind the music we love!
Web: Data Plus Music
Twitter: #DataPlusMusic
Zugehörige Storys

DataFam Roundup June 2026

DataFam Roundup May 2026

Iron Viz 2026: Read Between the Data
 28 Mai, 2026