DataFam Roundup: February 20-24, 2023


Welcome! Dig into this week's DataFam Roundup—a weekly blog that brings together community content all in one post. As always, we invite you to send us your content—and the DataFam content from your peers that have inspired you! Find the content submission form here.
Black History Month with the Tableau Community
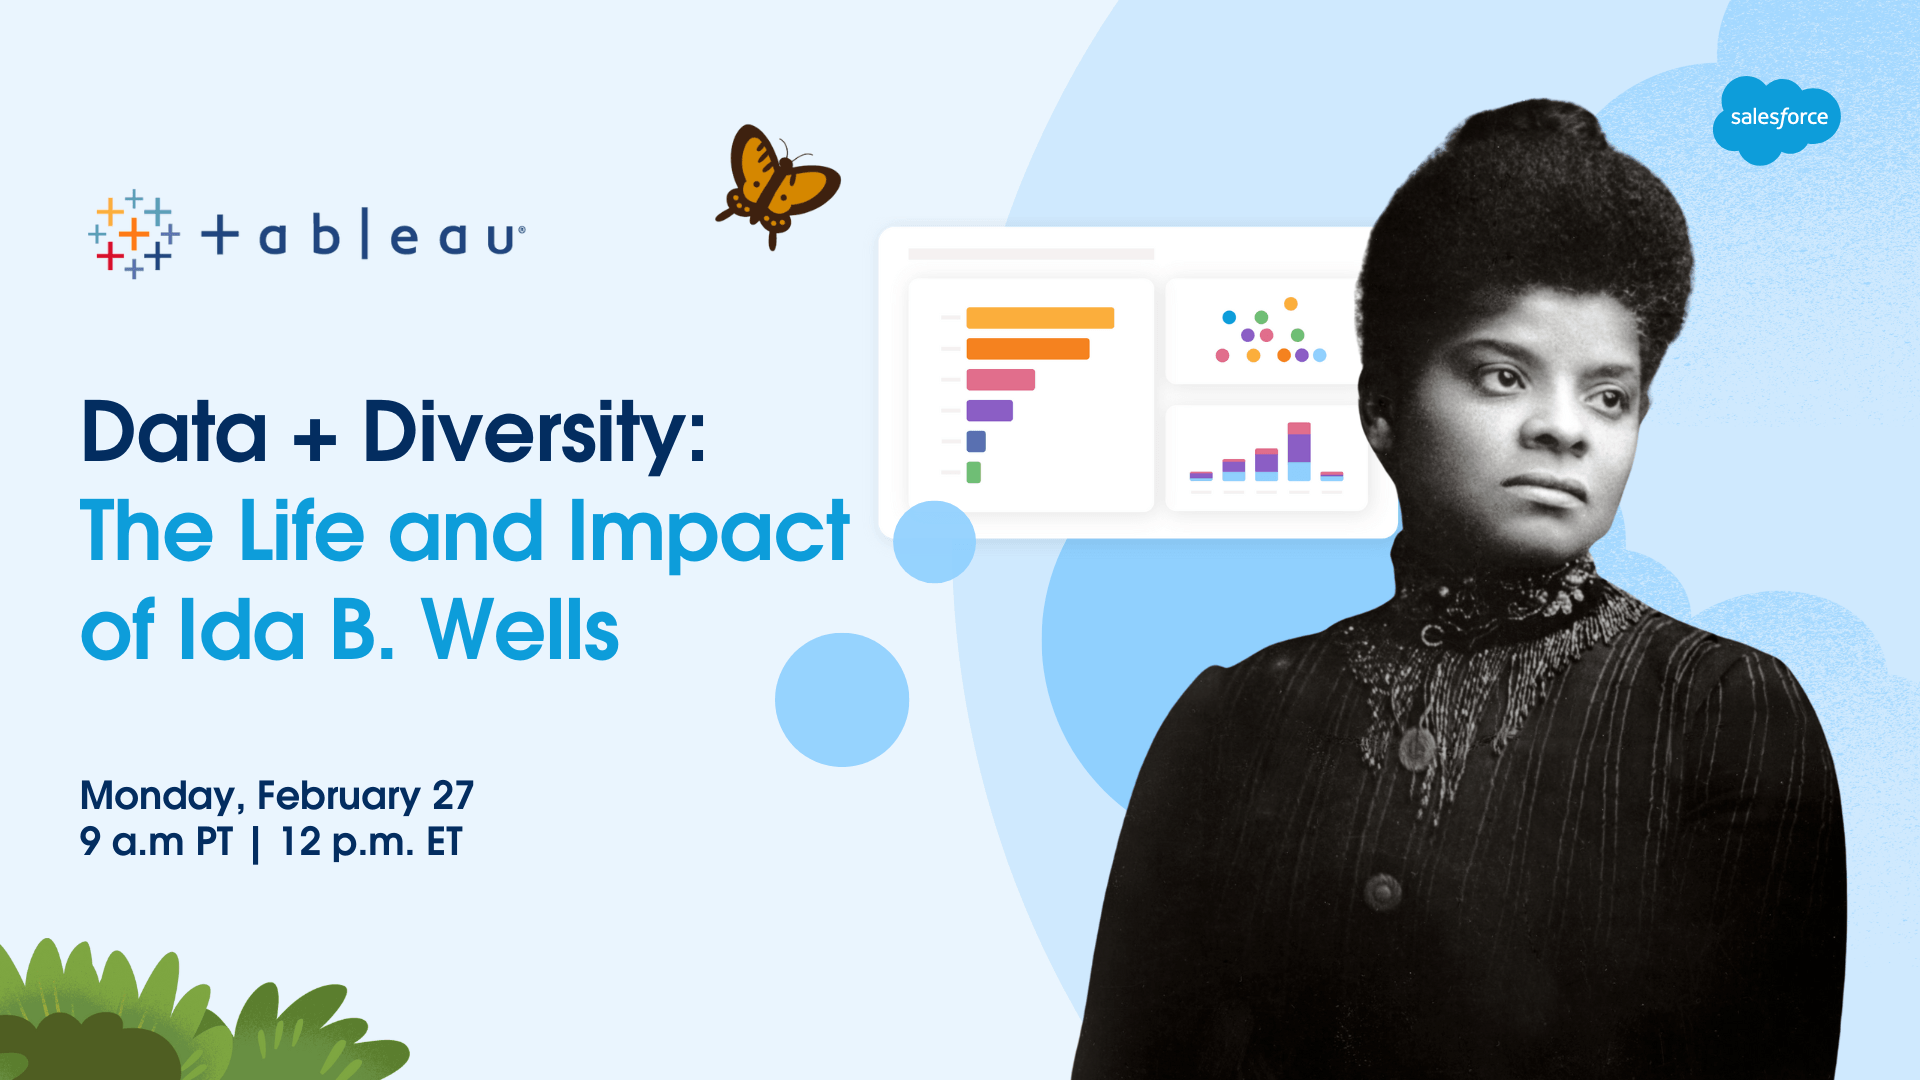
Data + Diversity Event: “The Life and Impact of Ida B. Wells” (Feb. 27)
- Weekly Viz of the Day's Each week Tableau Public will be featuring a viz celebrating Black History Month.
-
Tableau Public Featured Authors: Black History Month Edition
- Community Data Visualization Challenges: The DataFam has launched a series of data challenges celebrating Black History Month. Check them out below!
-
Back to Viz Basics - Build a symbol map–interactive visualizations that use symbols to represent data points on a map–using geographic data for African American Museums in the United States.
-
Diversity in Data - Highlight the inventions of African Americans in the United States
-
Viz for Vets - Tell a story of the African American experience during World War II through Survey 32 data, administered by the Army to look at the attitudes of African American and white soldiers during the war. They are also having a kickoff meeting on Feb 22
-
DuBois Visualization Challenge - Back for its third year, celebrate the data visualization legacy of W.E.B Du Bois by recreating his visualizations from the 1900 Paris Exposition
-
-
Data + Diversity Event: “The Life and Impact of Ida B. Wells” (Feb. 27) Learn more about the life and legacy of Ida B. Wells, a prominent journalist, activist, and researcher in the late 19th and early 20th centuries who pioneered data journalism.
- Sedale McCall, Using an Equality Lens in Data Visualization
DataFam content

Zach Bowders: Data + Love
Dive into content created by the Tableau Community:
-
Zach Bowders, Data + Love: The intersection of Data Analysis and Passion.
- Nate Mayfield, Data Leadership Collaborative: 5 Ways to Lead with Data
- Adam Mico, Data Leadership Collaborative: How Data Collaboration Transforms Organizations
- Sarah Burnett, Data Leadership Collaborative: Five Ways to Practice the Art of Data Persuasion
- Sekou Tyler, Ten Minute Tuesday with Chantilly Jaggernauth
Team Tableau
-
Trailhead, Equity and Inclusion Guidelines for Data Visualization
-
Behind the Viz: Brittany Rosenau Streamlines Creating Custom Color Palettes in Tableau
-
Can ChatGPT do data analysis? (SPOILER: NO!!), Andy Cotgreave
Upcoming events and community participation
-
Data Super Star: The theme of this competition is insightfulness, navigability, and user-friendliness. We are looking for BUSINESS DASHBOARD that effectively communicate key insights and patterns in the data, allow for easy exploration, and provide a positive user experience.
-
Dataviz Conferences to not miss in 2023 Are you ready to join the global dataviz community? Fortunately, there are a number of amazing conferences held throughout this year that can help you network with your peers, uncover new learnings, give you memories, and lot of fun. Let’s check them.
-
Data Superstar: Get ready for a data visualization extravaganza! Our competition is all about showcasing the best and brightest in data visualization. The theme of this competition is insightfulness, navigability, and user-friendliness. We are looking for visualizations that effectively communicate key insights and patterns in the data, allow for easy exploration, and provide a positive user experience.
-
Community Calendar and Upcoming Events: stay up-to-date on the latest Women in Dataviz events and other data visualization-related events. If you'd like to submit an event to the calendar, please fill out this form.
Vizzes
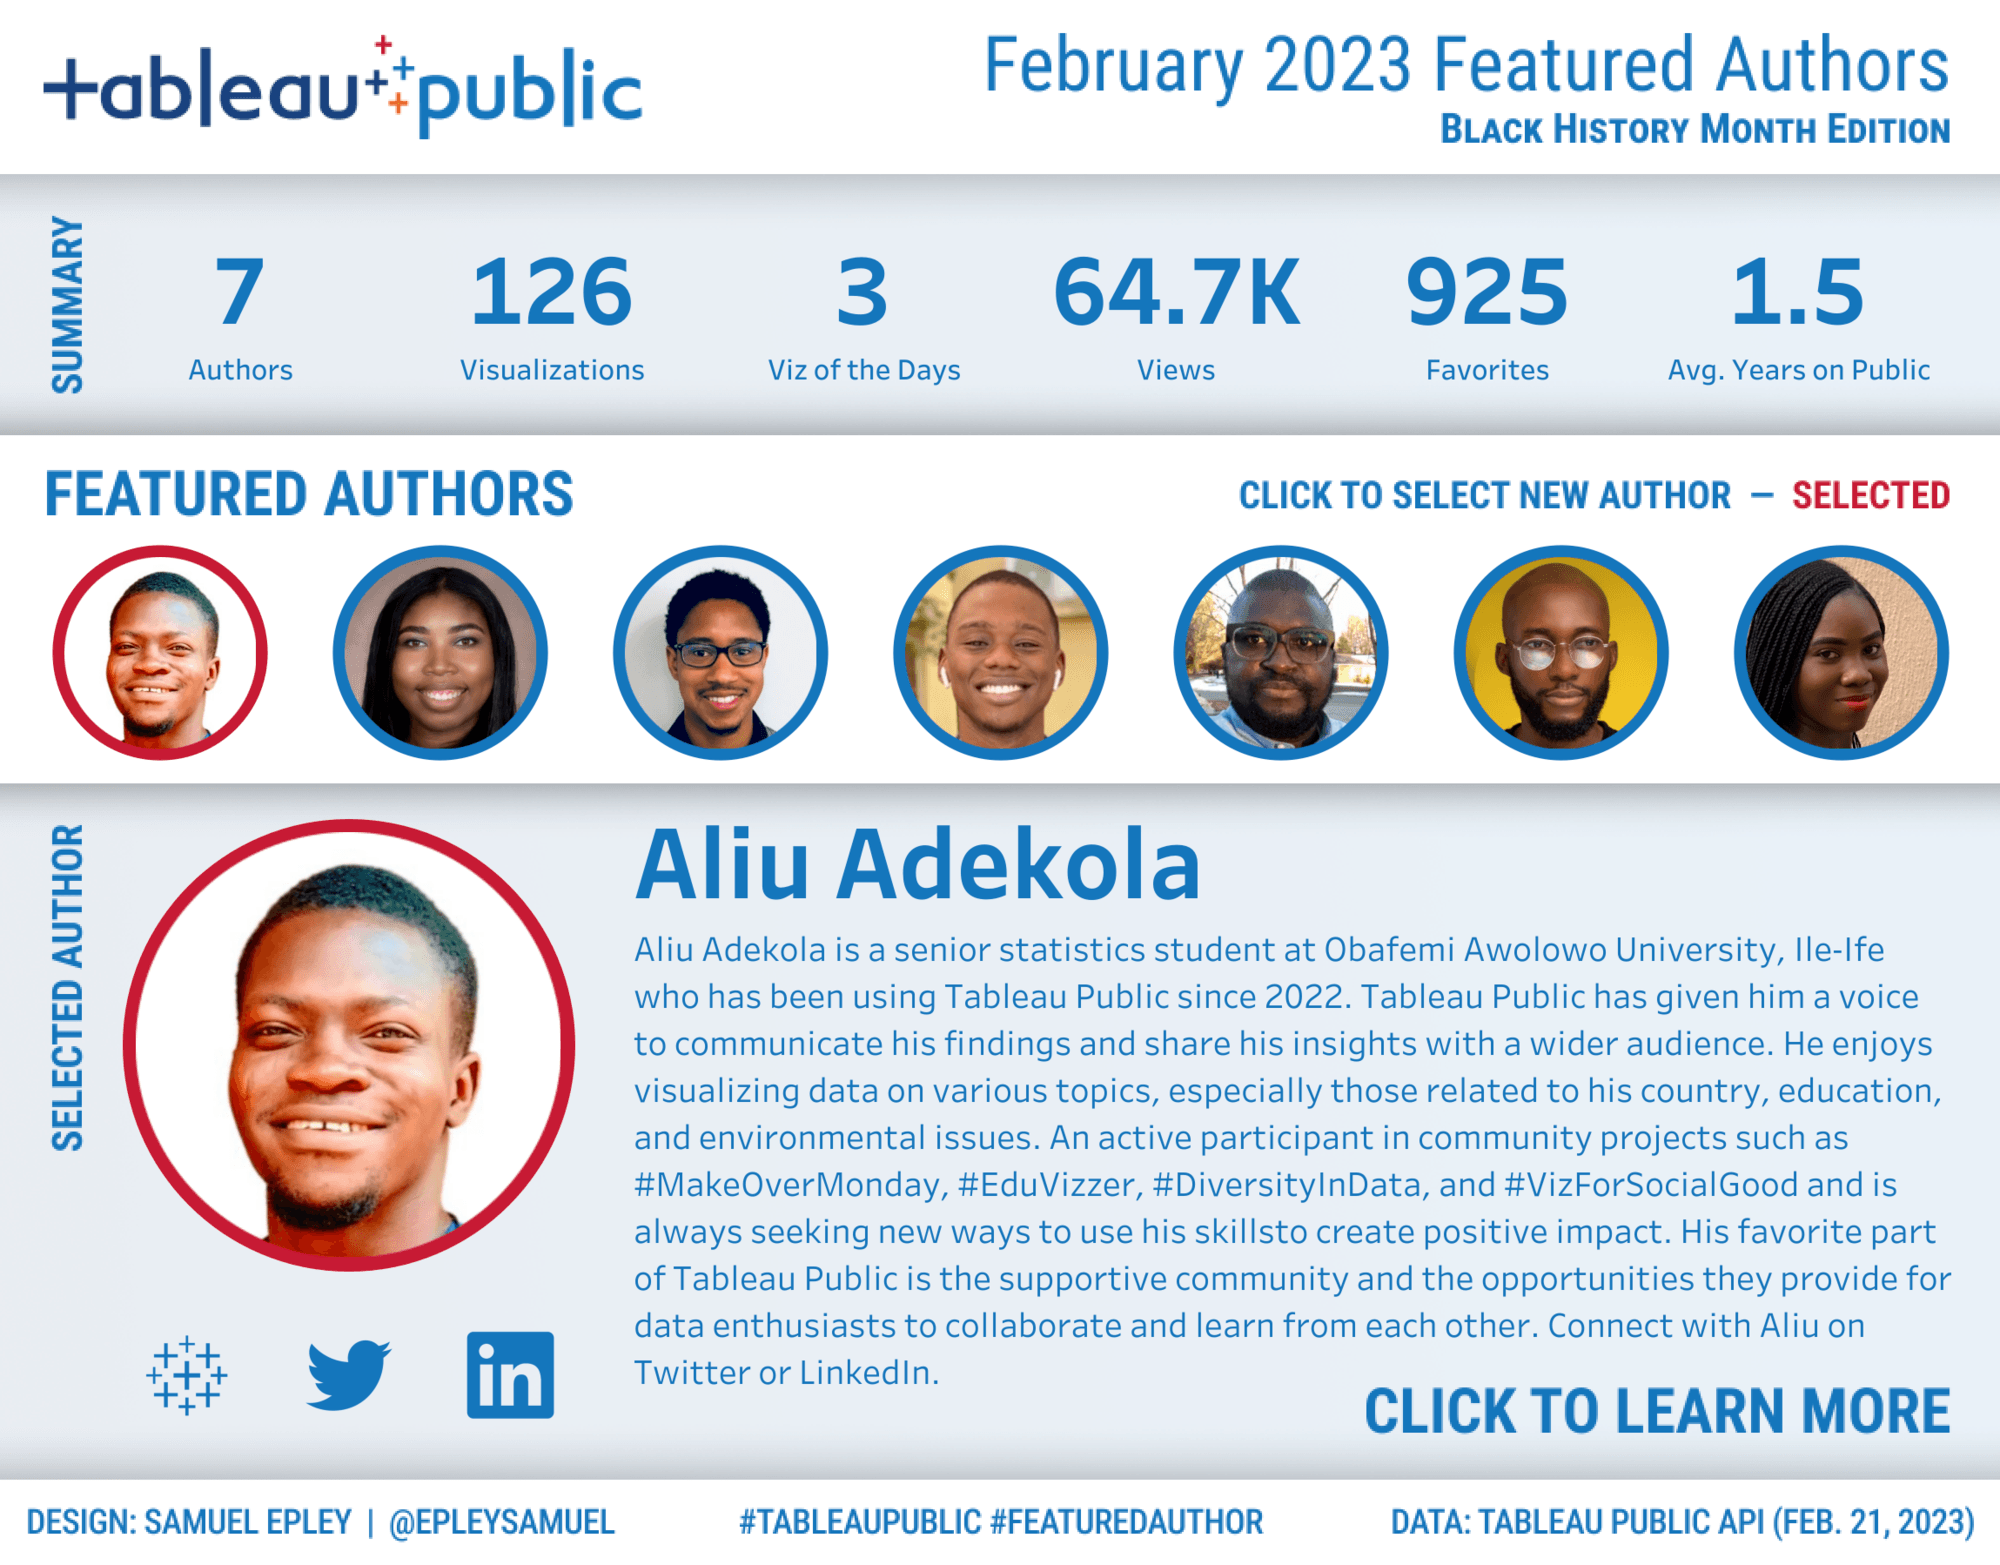
Sam Epley: Tableau Public Featured Authors: Black History Month Edition - February 2023 Cohort
See the latest Viz of the Day, trending vizzes, featured authors, and more on Tableau Public.
Check out some inspirational vizzes created by the community:
-
Ben Norland: Pit Bulls: Formula One Pit Stops
-
Alison Pitt: Arches Across America
-
Lisa Trescott: Beyoncé's Grammys
-
Sam Epley: Tableau Public Featured Authors: Black History Month Edition - February 2023 Cohort
-
Kevin Flerlage: The Tableau Visionary Collection (Formerly Zen Masters)
Community Projects
Back 2 Viz Basics
A bi-weekly project helping those who are newer in the community and just starting out with Tableau. Not limited just to newbies!
Web: Back 2 Viz Basics
Twitter: #B2VB
Week 3: Build a Symbol Map
Workout Wednesday
Build your skills with a weekly challenge to re-create an interactive data visualization.
Web: Workout Wednesday
Twitter: #WOW2022
Week 7: Can you create a Jittered Bar Chart?
Makeover Monday
A weekly social data project.
Web: Makeover Monday
Twitter: #MakeoverMonday
Week 7: Global Electric Vehicle Market Share
Preppin' Data
A weekly challenge to help you learn to prepare data and use Tableau Prep.
Web: Preppin’ Data
Twitter: #PreppinData
Week 7: Flagging Fraudulent Suspicions
DataFam Con
A monthly challenge covering pop culture and fandoms.
Web: DataFam Con
Twitter: #DataFamCon
February 2023: (Reality) Love is in the Air!
EduVizzers
A monthly project connecting real education data with real people.
Web: Eduvizzers
February 2023: World Bank Youth Literacy Rates
Games Night Viz
A monthly project focusing on using data from your favorite games.
Web: Games Nights Viz
Twitter: #GamesNightViz
January 2023: Is it a Sport or a Game?
Iron Quest
Practice data sourcing, preparation, and visualization skills in a themed monthly challenge.
Web: Iron Quest
Twitter: #IronQuest
November 2022: Weird or Wonderful
Public Policy Viz
Bridging the gap between analytics professionals and policy practitioners.
Web: Public Policy Viz
Twitter: #PublicPolicyViz
Project 1: Redlining in Pittsburgh, PA
Data Plus Music
A monthly project visualizing the data behind the music we love!
Web: Data Plus Music
Twitter: #DataPlusMusic
Storytelling with Data
Practice data visualization and storytelling skills by participating in monthly challenges and exercises.
Web: Storytelling with Data
Twitter: #SWDChallenge
February 2023: partner up
Project Health Viz
Uncover new stories by visualizing healthcare data sets provided each month.
Web: Project Health Viz
Twitter: #ProjectHealthViz
January 2023: Medicaid Drug Spending 2020
Diversity in Data
An initiative centered around diversity, equity & awareness by visualizing provided datasets each month.
Web: Diversity in Data
Twitter: #DiversityinData
February 2023: BHM & the New Year
Sports Viz Sunday
Create and share data visualizations using rich, sports-themed data sets in a monthly challenge.
Web: Sports Viz Sunday
Twitter: #SportsVizSunday
January 2023: Is it a Sport or a Game?
Viz for Social Good
Volunteer to design data visualizations that help nonprofits harness the power of data for social change.
Web: Viz for Social Good
Twitter: #VizforSocialGood
Sept 2-Sept 30 2022: India Water Portal/Arghyam
Real World Fake Data
Create business dashboards using provided data sets for various industries and departments.
Web: Real World Fake Data
Twitter: #RWFD
Session 5: Diversity Score Card
SDG Viz Project
Visualize data about Sustainable Development Goals provided by the World Health Organization.
Web: SDG Viz Project
Twitter: #TheSDGVizProject
Zugehörige Storys

DataFam Roundup June 2026

DataFam Roundup May 2026

Iron Viz 2026: Read Between the Data
 28 Mai, 2026