Recapping cloud analytics success at AWS re:Invent 2017


We recently spent four exhilarating days at AWS re:Invent. From expanding database options to making AI easy for everyday developers, re:Invent showcased AWS’s commitment to launching services that adapt to whatever architecture and technology shifts occur and improve customer experiences as a result (The full list of announcements is available here). Inspired by this shared vision to innovate and delight our customers, Tableau has a long history of integrating with AWS services to empower enterprises and maximize the return on their organization’s data. This year at Tableau, we've seen a large spike in the number of customers choosing to deploy the Tableau platform on AWS infrastructure and databases. Several of these customers were onsite at re:Invent and the Tableau team met many of them and learned how we can better serve their growing needs.

Two of our longtime customers – Sysco and Expedia – presented how they are using Tableau to empower their people with self-service analytics on top of massive datasets on AWS.
The two sessions collectively represented a microcosm of all the enterprise use cases we normally see in the cloud analytics world.
Sysco enterprise-wide transformation exercise
Navin Advani, VP of Enterprise Data Management at global food distributor Sysco, presented during re:Invent and focused on the people, process, and technology aspects of deploying successful analytics at enterprise scale. As Eric Ries, says in the seminal book “The Lean Startup”, the oft forgotten management elements frequently dismissed as the “boring stuff” are what makes cool technology tick – and allows that technology to be adopted widely. And it was fascinating to watch Navin distill the key motivators, business drivers, delivery models, change management, org structures, governance, training, and the process improvements that underpinned their analytics strategy.
Starting with the business drivers, Sysco’s analytics charter was informed by the goals of its three-year operating plan: Unlock savings, drive top line growth and market share, enabled by quick actionable insights. Navin highlighted that Sysco’s current state of analytics infrastructure was not fit to deliver that plan: It was plagued by the lack of abilities to analyze large volumes, reporting inconsistencies, long lead times, creeping cost of ownership and scalability, and stability issues. Navin and team needed an enterprise view of its customers, products, and suppliers that would deliver more intuitive information to internal and external customers through a self-service reporting model, which in turn would ultimately enable revenue growth and operational efficiencies with better data management and better decisions.
Sysco undertook an enterprise-wide transformation exercise and their data and analytics processes morphed and matured throughout the years. In certain business functions, there has been a shift from consuming hindsight information using row and column-based flat reports to ad-hoc data analysis for deriving insights to support better decisions – and even developing some predictive analytics. This has provided a launch pad for further development of Sysco’s analytics capabilities, driving them to a data driven culture, and serving as a catalyst for the business intelligence roadmap.
With “Tableau on AWS”, Sysco is able to implement their vision for a “Sysco Ecosystem for Enterprise Data” aka “SEED”. Navin talked about how “SEED” was envisioned to scale with evolving business needs and provided a foundation for data governance and data security. SEED was cloud native. This meant that Sysco could move from “build first and see later” to a more agile and “continuous improvement” approach towards analyzing business data that involved setting up the ability to quickly stand up sandbox environments for experimentation. “SEED” was also developed with broad and deep functionality to support a range of use cases across multiple functions including marketing (Churn Analysis, Share of Wallet, ML for future promotions etc.), Merchandising (Assortment optimization, Market Basket, Lotting using decision trees etc.) and Revenue management (Predictive pricing simulations, Pass thru predictive pricing, Margins review etc.)
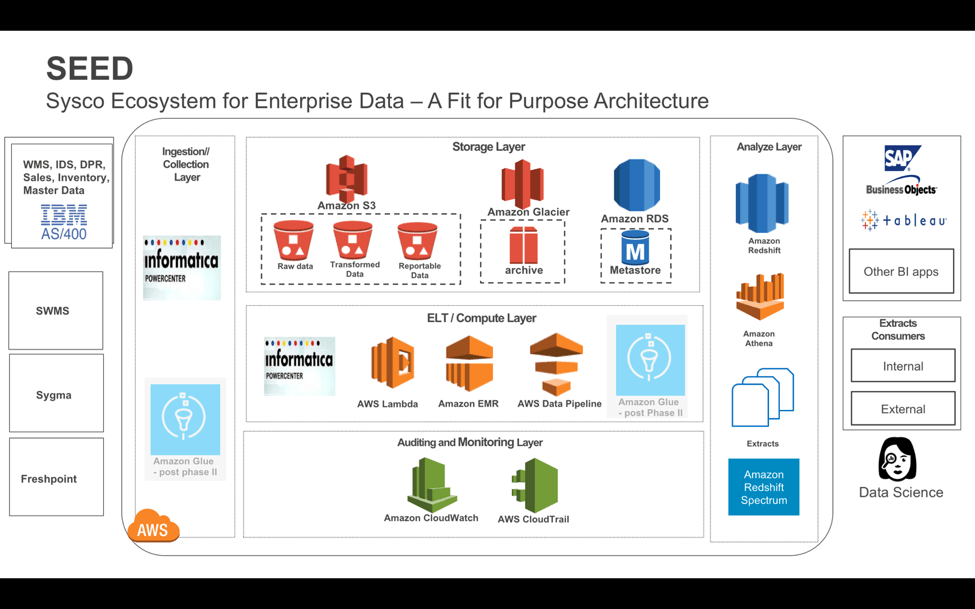
The agility, governance, cost leverage and discipline that SEED has brought to how data is mined and used at SYSCO has delivered amazing results. People feel empowered to use data in their day to day work and usage numbers have exploded from 64 to 12,713 (roughly a 20x increase) in three years.
You can watch the Sysco talk in full here.
Expedia’s commitment to analytics accessibility and scale
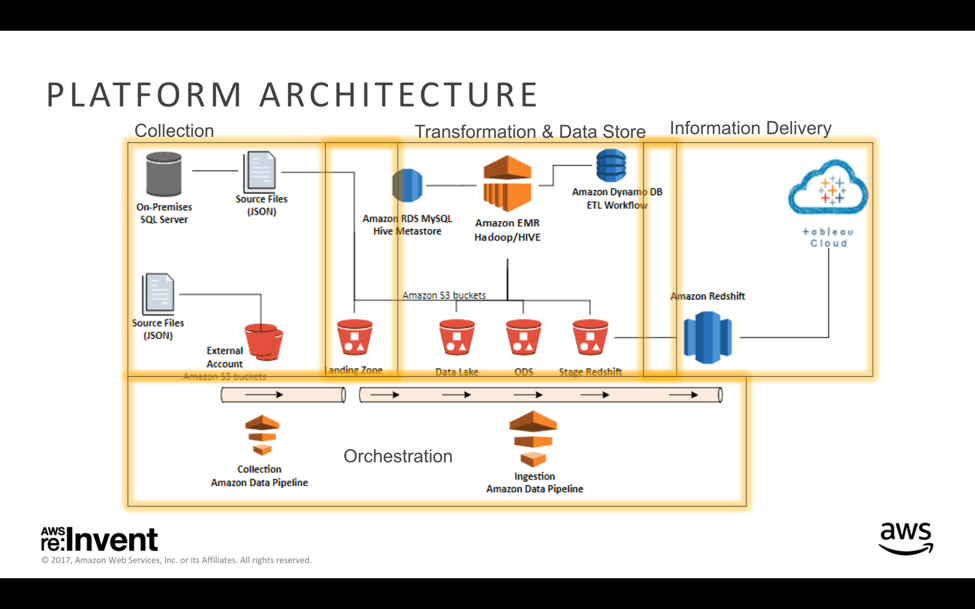
Tad Buhman - a business owner in the Expedia Consumer Payments team and Anna Terp, a database developer responsible for building the stack that can serve the needs of her internal stakeholders were two contrasting personas that told a powerful architecture and best practices story. Tad and Anna are part of the Expedia group whose purpose is to report how effectively the company is collecting payments from qualified customers. Credit card transactions are incredibly expensive and analyzing the cost associated with collecting payments is crucial to Expedia. To accomplish this, they required an analytics system that was fast, reliable, scalable – and could be confidently provisioned to non-technical business users.
While AWS provided impermanent and scalable architecture components that could be evolved on-demand, Tableau provided a usable and familiar insights platform, that was easily consumable, regardless of skill set. In addition, two things were of particular importance to Expedia. First, that Tableau Online was fully managed, giving Expedia the assurance that the latest version was available at all times. Second, that Tableau Online allowed distributed server administration, which gave “data custodians” full control on folders, permissions, and the ability to add users with little lead times. The benefits of Tableau Online are accentuated for Expedia and many other customers with data sources in the West Coast of the US with the launch of Tableau Online’s West Coast data center on AWS last week.
In Tad Buhman’s own words “At Expedia, we want to be analysts, not report writers. Tableau allows users to uncover hidden patterns, irregularities and gain awareness. Our job was to make the data accessible, consistent and reliable for business users”
Along the way, Expedia’s team imparted some best practices about how to think about agile design. This included the importance of having loosely coupled interfaces (i.e. it was important that each component was not too tightly integrated nor interdependent, allowing for independent development which didn’t have to happen in sequence) and the importance of prototyping (They created working components to leverage AWS and get the most out of testing various services). Expedia also shared numerous techniques and dos and don’ts to the optimize performance of Tableau on AWS data and other data sources.
You can watch the Expedia talk in full here.
Tableau on Amazon Redshift best practices whitepaper
Last week also marked the launch of the newest version of Tableau’s “Optimizing your Amazon Redshift and Tableau Software Deployment for Better Performance” (aka the Tableau on Redshift Best Practices paper). Amazon Redshift and Tableau Software are two powerful technologies in a modern analytics toolkit. They are integrated out-of-the-box, so you can connect Tableau to your Amazon Redshift data warehouse with minimal time or effort. It’s important to understand how to optimize each tool when integrating the two together: doing so can yield considerable performance gains and ultimately shorten deployment cycles. This paper introduces infrastructure advice as well as tips and hints to make the joint solution more efficient and performant. Read the full whitepaper here.
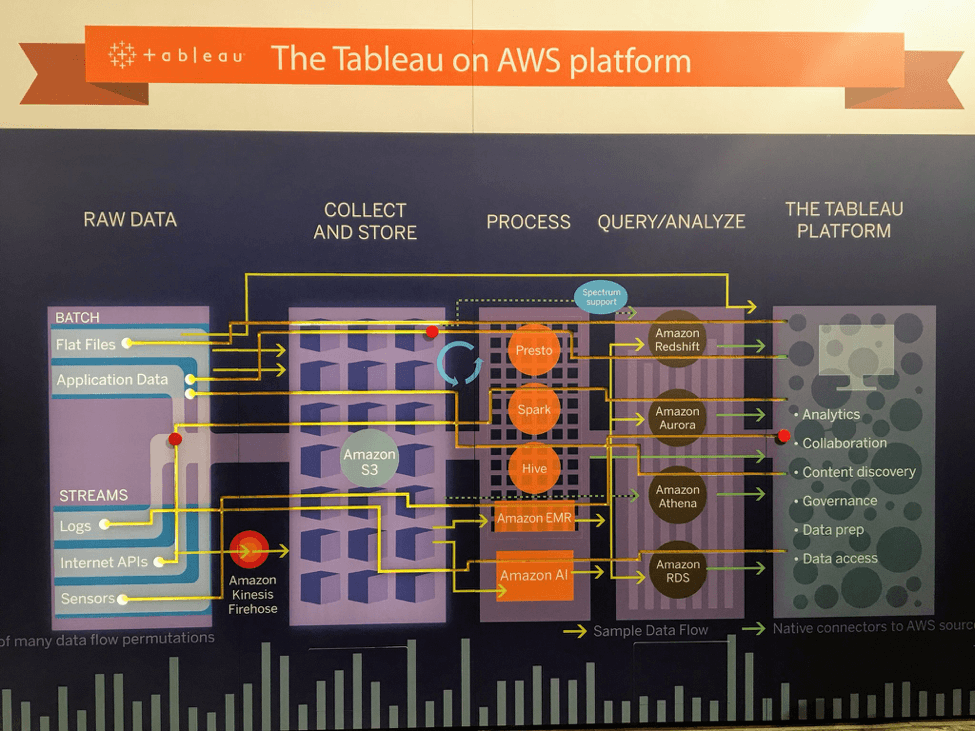
Reinventing flexibility at our booth!
We also had a ton of fun showcasing our platform to customers and partners on the trade show floor. This interactive back wall display was a big hit and allowed customers an opportunity to engage and visualize how Tableau could help them see and understand data flowing through the AWS stack.
The more we integrate with the wide world of AWS, the wider the range of possibilities for our customers. As you can see, it was an exciting week. We were fortunate to talk to many of you, and we heard what you want to do with your analytics in the cloud. We'll be taking that into account as we continue to build on our deep partnership with AWS.
Zugehörige Storys
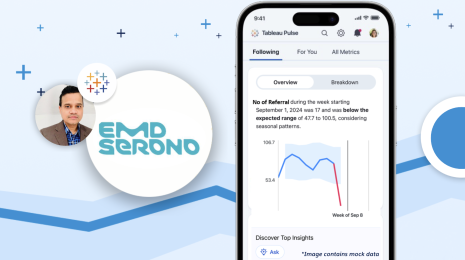
How EMD Serono is improving patient care with personalized, AI-powered insights from Tableau
 30 September, 2024

Embedded Analytics: Should you build or buy?
 7 Juni, 2022

Data fabric’s value to the enterprise
 11 Mai, 2022